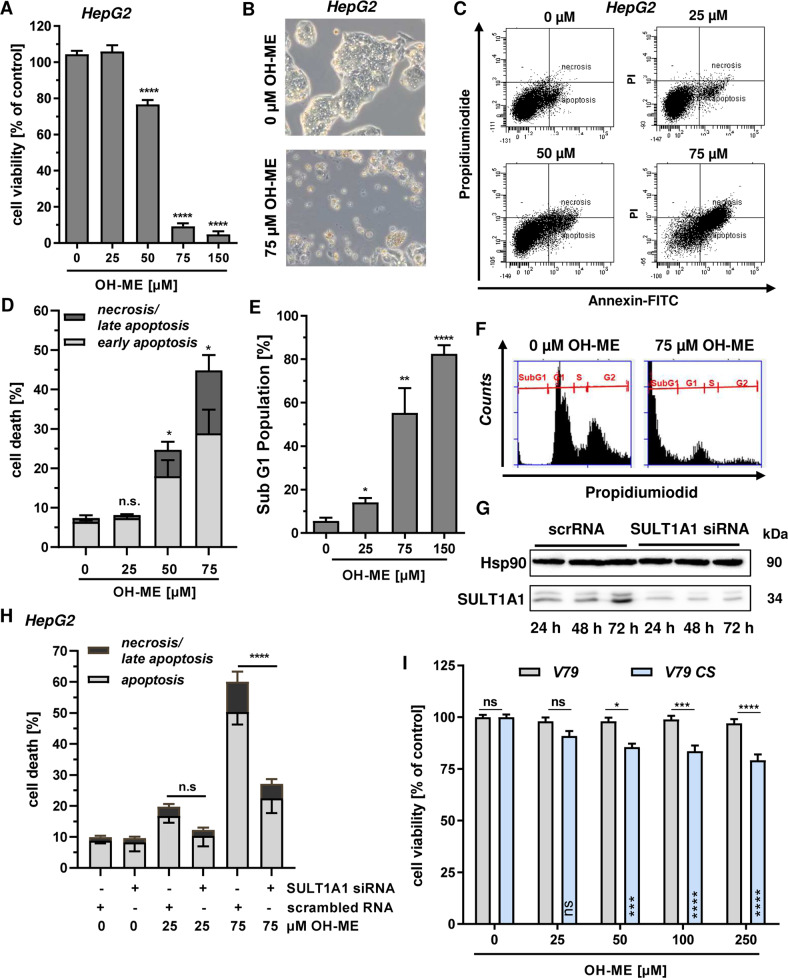
Fig. 3. Cytotoxicity of ME-triggered DNA damage and impact of SULT1A1.
A Viability of HepG2 cells challenged with increasing concentrations of OH-ME for 72 h. Viability was determined by the MTS assay (n = 3). B Morphology of HepG2 cells treated with 75 µM OH-ME or solvent control (0 µM) as revealed by light microscopy. C, D Cell death induction by OH-ME in HepG2 cells. Cells were exposed to OH-ME for 72 h followed by Annexin V-FITC/PI staining and analysis by flow cytometry (n = 3). Representative dot plots of Annexin V-FITC/PI staining are shown. E, F Analysis of subG1 population in HepG2 cells exposed to increasing concentrations of OH-ME for 72 h. Cells were harvested, stained and subG1 population indicative of apoptosis was determined by flow cytometry (n = 4). Representative histograms are shown. G siRNA-mediated knockdown of SULT1A1 in HepG2. Cells were transfected with SULT1A1 siRNA or scrambled siRNA (scrRNA) and SULT1A1 expression was monitored for up to 72 h by western blot analysis. Hsp90 served as loading control. H Impact of SULT1A1 knockdown on OH-ME triggered cell death. HepG2 cells were transfected as described above and then challenged with OH-ME. Cell death induction was measured by Annexin V-FITC/PI staining after 72 h (n = 3). I Viability of V79 and V79 CS cells upon treatment with OH-ME. Cells were exposed to increasing OH-ME concentrations (0–250 µM) and viability was assessed after 72 h using the MTS assay (n = 3). Data in A–I are shown as mean + SEM. Ns: not significant, p > 0.05, *p < 0.05, **p < 0.01, ***p < 0.001, ****p < 0.0001.

