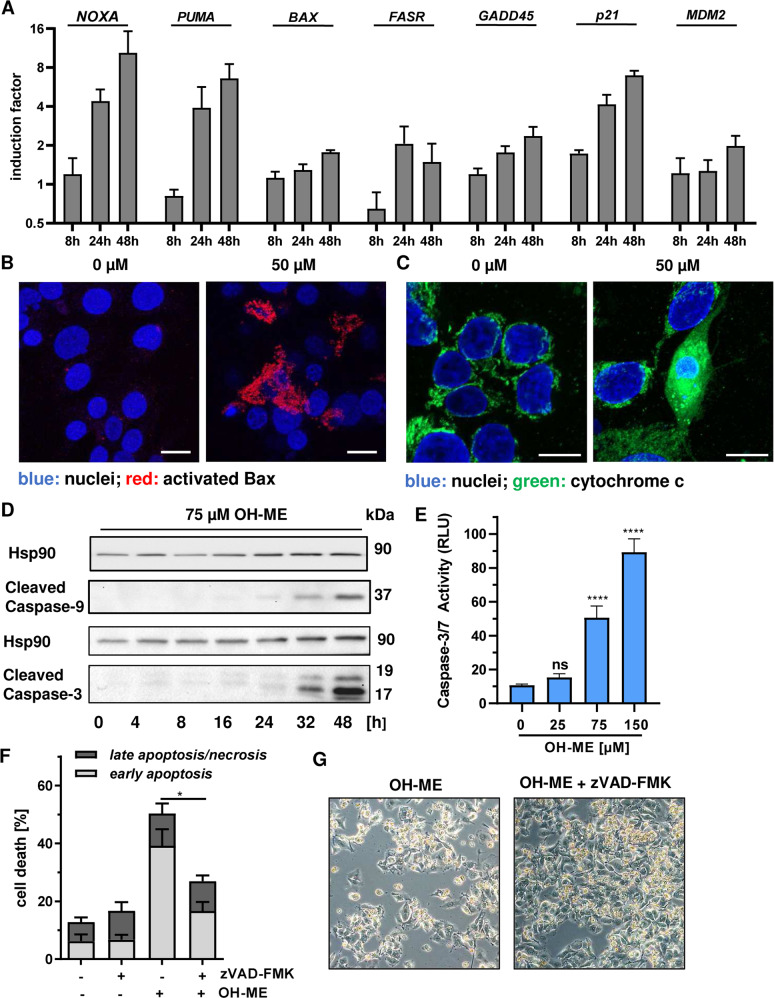
Fig. 4. ME-derived DNA damage triggers caspase-dependent mitochondrial apoptosis.
A Time-dependent expression of pro-apoptotic genes (NOXA, PUMA, BAX, FASR) and other p53-related genes (GADD45, p21, MDM2) in HepG2 cells after treatment with 75 µM OH-ME for up 48 h. Gene expression was assessed by qPCR (n = 4). B Assessment of Bax activation in HepG2 cells treated with 50 µM OH-ME for 48 h. Cells were fixed, processed and immunostained for activated Bax (red), while nuclei were visualized by DAPI. Images were acquired by confocal microscopy. Scale bar: 20 µm. C Analysis of cytochrome c release in HepG2 cells after OH-ME treatment by confocal microscopy. Cells were incubated for 48 h, fixed and stained for cytochrome c (green). Nuclei were counterstained with DAPI (blue). Samples were then analyzed by confocal microscopy and processed by ZEN software. Scale bar: 20 µm. D Time-dependent caspase cleavage in HepG2 following OH-ME treatment. Cells were incubated with 75 µM OH-ME for up to 48 h. Samples were analyzed by SDS-PAGE and western blot detection for caspase-9 and caspase-3 cleavage. Hsp90 served as loading control. A representative blot is shown. E Determination of caspase-3/-7 activity upon OH-ME exposure. Cells were treated for 24 h with increasing concentrations of OH-ME, harvested and analyzed for caspase-3/-7 activity using a luminogenic substrate (n = 3). F Impact of caspase inhibition on OH-ME triggered cell death. HepG2 cells were treated with 75 µM OH-ME in the absence or presence of the pan-caspase inhibitor zVAD-FMK for 48 h. Cell death induction was analyzed by Annexin V-FITC/PI staining and flow cytometry (n = 3). G Representative microscopy images of HepG2 cells treated with OH-ME in the absence or presence of the pan-caspase inhibitor zVAD-FMK. Data in A, E, and F are given as mean + SEM. Ns: not significant, p > 0.05, *p < 0.05, ****p < 0.0001.

