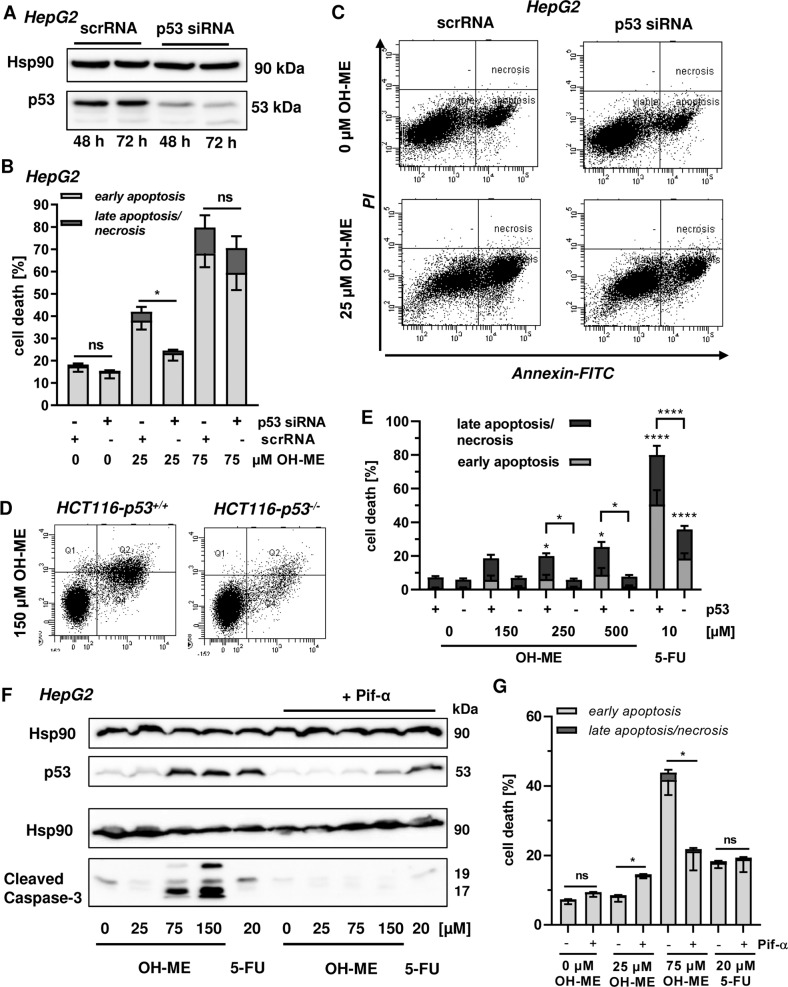
Fig. 5. Role of p53 in OH-ME triggered apoptosis.
A Transient knockdown of p53 in HepG2 cells. Cells were transfected with siRNA directed against p53 (p53 siRNA) or scrambled siRNA (scrRNA) and harvested after 48 or 72 h. p53 expression was then analyzed by SDS-PAGE and western blot detection. Hsp90 served as loading control. B Knockdown of p53 and cell death induction by OH-ME. HepG2 cells were transfected with p53 siRNA or scrambled RNA followed by treatment with OH-ME. Cell death induction was analyzed by Annexin V-FITC/PI staining and flow cytometry (n = 4). C Representative dot plots of Annexin V-FITC/PI staining. D, E Isogenic HCT116 cells proficient or deficient for p53 were challenged with increasing OH-ME concentrations for 72 h. 5-FU served as positive control. Cell death was assessed as described above (n = 4). Representative dot blots are depicted. F Pharmacological inhibition of p53 and impact on caspase-3 cleavage triggered by OH-ME. HepG2 cells were pre-treated or not with the p53 inhibitor pifithrin-α for 2 h and then challenged with increasing concentrations of OH-ME (0–150 µM) for 24 h. Samples were subjected to SDS-PAGE followed by western blot analysis of p53 and cleaved caspase-3. As loading control, Hsp90 was detected. G Pharmacological inhibition of p53 and cell death induction by OH-ME. HepG2 cells were pre-incubated with pifithrin-α or not and then exposed to OH-ME for 48 h. Cell death was assessed by Annexin V-FITC/PI staining and flow cytometry. Data in B, E, and G are given as mean + SEM. Ns: not significant, p > 0.05, *p < 0.05.

