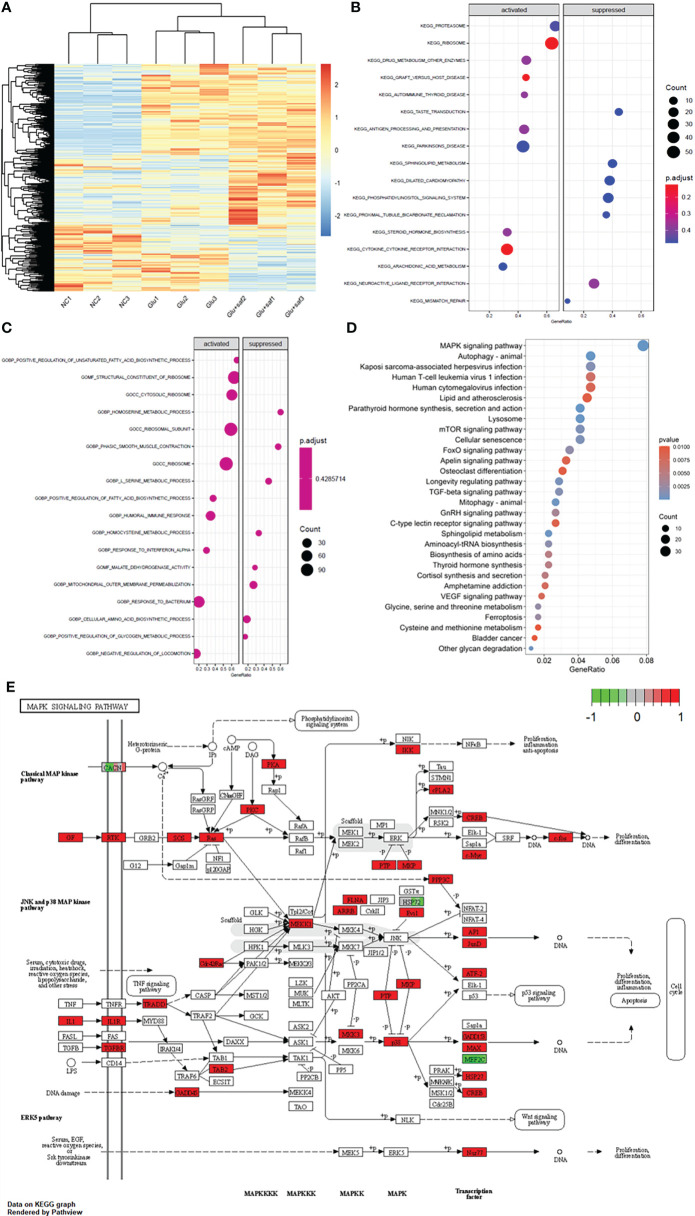
Figure 4.
Transcriptome sequencing results. (A) shows the heat map of the three groups including the negative control, high glucose group, and high glucose treated with safranal group. (B, C) demonstrate the Kyoto Encyclopedia of Genes and Genomes (KEGG) and Gene Ontology (GO) results between the high glucose group and high glucose treated with safranal group. From the bubble graph, the MAPK signaling pathway demostrateda high gene ratio (D) and the detailed pathway was demonstrated in (E).

