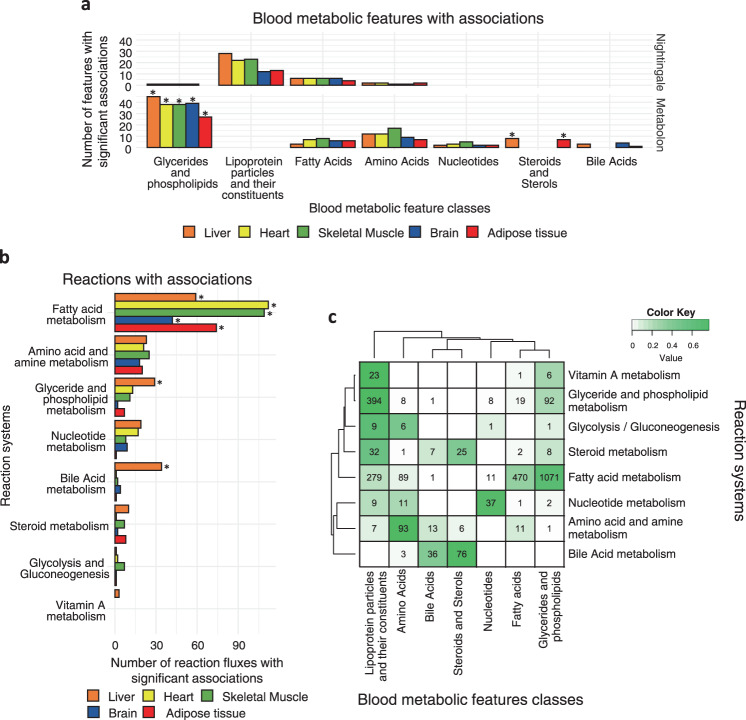
Fig. 3. Characterisation of the significant associations between blood metabolic features and metabolic fluxes.
a Classes of blood metabolic features with one or more significant associations to the fluxome. *denotes classes that are significantly enriched (one-sided Fisher’s exact test, FDR-adjusted P value < 0.05). FDR-adjusted P values for significantly enriched classes: Glycerides and phospholipids (Metabolon): Liver: 2.5 × 10⁻¹², Brain: 3.7 × 10⁻¹², Heart: 6.9 × 10⁻¹², Skeletal Muscle: 2.9 × 10⁻¹¹, Adipose tissue: 3.3 × 10−06; Steroids and sterols (Metabolon): Adipose tissue: 0.019, Liver: 0.045. Unannotated features and classes with few features are omitted for clarity. b Systems of the reactions whose flux values are significantly associated with one or more blood metabolic features. *denotes systems that are significantly enriched (one-sided Fisher’s exact test, FDR-adjusted P value < 0.05). FDR-adjusted P values for significantly enriched systems: Fatty acid metabolism: Skeletal muscle: 3.3 × 10⁻³⁰, Heart: 3.6 × 10⁻²⁷, Adipose tissue: 2.0 × 10⁻¹⁷, Brain: 1.2 × 10⁻¹⁵, Liver: 5.5 × 10⁻¹⁰; Bile acid metabolism: Liver: 2.6 × 10−05; Glyceride and phospholipid metabolism: Liver: 0.041. Unannotated reactions and systems with few features are omitted for clarity. c Heatmap of the intersection between blood metabolic feature classes and reaction systems in significant associations. Numbers at each intersection denote the number of significant associations between reaction fluxes of a given system and blood metabolic features of a given class. The colour key denotes the fraction of reactions of each system in each intersection.

