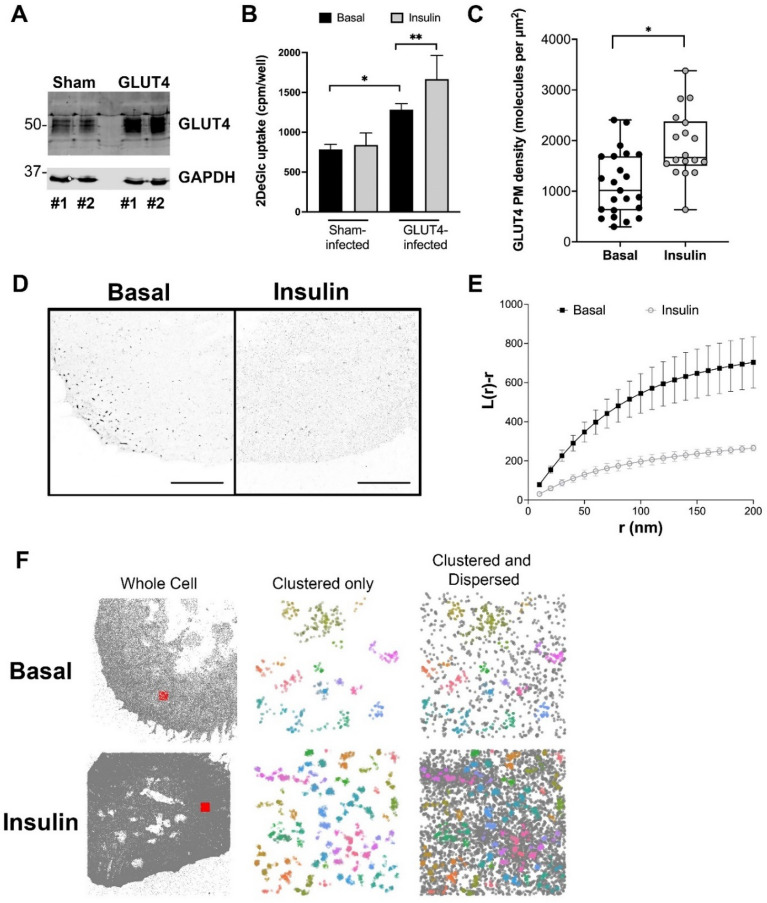
Figure 1.
Behaviour of GLUT4 in iPSC-cardiomyocytes. (A) We over expressed human GLUT4 using lentivirus in iPSC-CMs. Shown are two representative examples (#1 and #2) of empty virus infected cells (‘Sham’) and cells infected with GLUT4 virus (‘GLUT4’). Lysates were immunoblotted for GLUT4 and GAPDH and increased levels of GLUT4 are evident in GLUT4-virus infected cells. Levels of over-expression ranged from 2- to fourfold between experiments. (B) Deoxyglucose (DeGlc) uptake was assayed in the presence and absence of insulin in parallel batches of virus infected cells. Data shown is from three independent biological replicates. GLUT4 overexpression increased basal glucose transport (*p = 0.01), and cells overexpressing GLUT4 exhibited insulin-stimulated glucose transport (**p = 0.05). Sham-infected cells did not exhibit insulin-stimulated glucose transport. Statistical analysis was performed using an unpaired t-test on raw data. (C) We expressed HA-GLUT4-GFP in iPSC-CMs and quantified localisation density of cell surface GLUT4 (as HA staining) before and after stimulation with 100 nM insulin for 20 min. The data from replicate experiments is presented as a box and whiskers plot, each point represents data from a single cell. Insulin stimulated a 1.7-fold increase in cell surface HA staining, *p = 0.0005 by unpaired two sample t-test. (D) Representative images of iPSC-CMs expressing HA-GLUT4-GFP stained for HA as outlined. Scale bars = 10 μm. (E) GLUT4 molecule coordinates were obtained using ThunderSTORM and their spatial pattern was analysed using normalized Riley’s K function (L(r)), derived from the Voronoï diagram of GLUT4 molecule coordinates. L(r) describes how many segmented clusters can be found within a distance r of any arbitrary point. Empirical estimates of L(r) are shown for basal and insulin-stimulated cells. The experiment was carried out independently on > n = 10 cells per group and the basal and insulin values differed significantly (p < 0.0001; determined by unpaired two samples t-test). (F) GLUT4 molecule coordinates were processed using a python HDBSCAN script written in house. Gray dots indicate single molecule localizations for representative whole cells (left panels). Representative 4 μm × 4 μm ROIs are highlighted by the red squares. The middle panels show coloured molecule clusters identified by HDBSCAN (‘clustered only’) and coloured clusters plus gray non-clustered molecules (‘clustered and non-clustered’, right panels) within representative ROI.

