Figure 2.
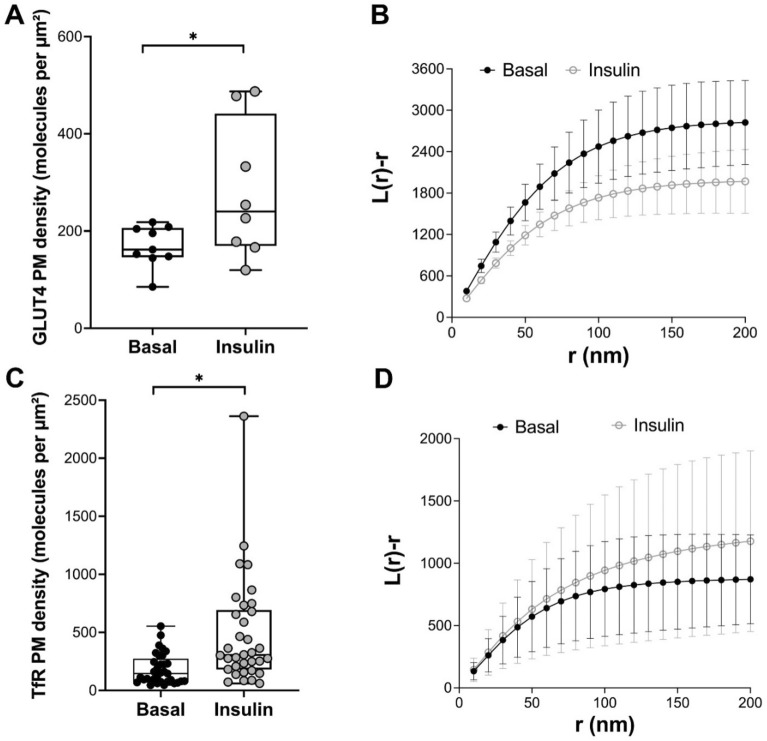
Behaviour of GLUT4 and TfR in HeLa cells. HeLa cells expressing HA-GLUT4-GFP were incubated in serum free media for 2 h, followed by insulin challenge (1 μM insulin for 20 min). Cells were fixed and the HA epitope was stained for dSTORM as outlined. (A) shows quantification of the density of cell surface GLUT4 (as HA staining) before and after insulin, presented as the merged data from at least 8 cells from 3 biological replicates (*p = 0.0007 determined by unpaired two samples t-test); each point is a measurement from a single cell. (B) GLUT4 molecule coordinates were obtained using ThunderSTORM. Empirical estimates of L(r) were calculated from the Voronoï diagrams of GLUT4 molecule coordinates under basal and insulin-stimulated conditions. The experiment was carried out independently on > 8 cells per group from 3 biological replicates and revealed a statistical difference between basal and insulin-stimulated cells (p = 0.0028; determined by unpaired two samples t-test). HeLa cells expressing TfR-GFP were used in a similar analysis. (C) shows quantification of TfR surface density before and after insulin treatment, presented as the merged data from > 30 cells from > 3 biological replicates (*p = 0.0005 determined by unpaired two samples test); each point is a measurement from a single cell. TfR molecule coordinates were obtained using ThunderSTORM and (D) shows estimates of L(r) under basal and insulin-stimulated conditions. No difference between basal and insulin-stimulated conditions was observed (p = 0.0683; determined by two-samples t-test).

