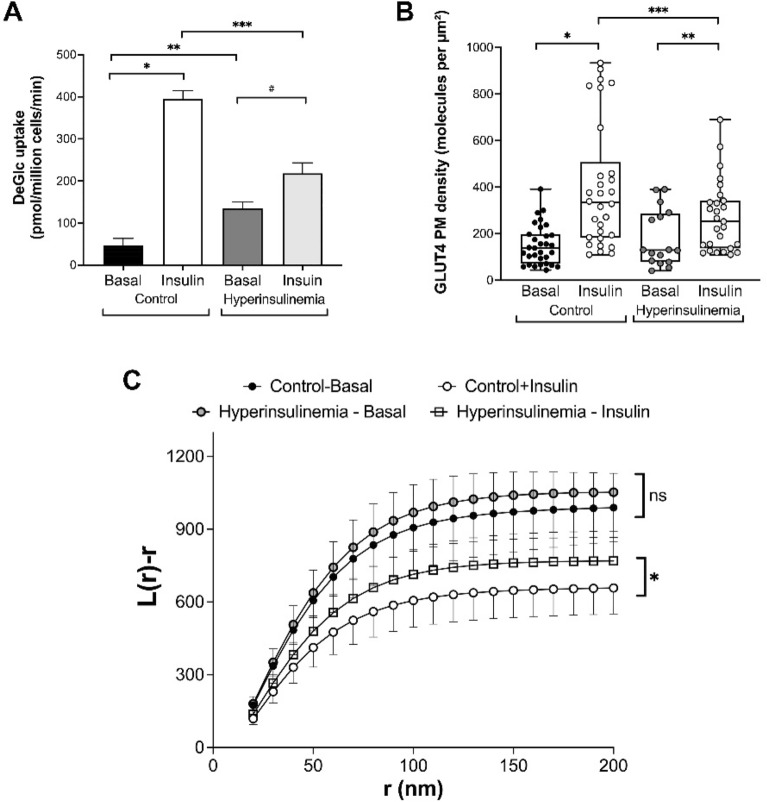
Figure 3.
Chronic insulin treatment modulates GLUT4 translocation and dispersal. 3T3-L1 adipocytes were incubated in normal media or in media supplemented with 500 nM insulin for 24 h (‘hyperinsulinemia’ in the figure) before washing as described in Methods. (A) shows the rates of 2-deoxyglucose (DeGlc) transport in response to an acute insulin challenge (100 nM, 20 min); insulin robustly stimulates glucose transport in control cells (8.4-fold; *p < 0.0001). Hyperinsulinemia results in elevated basal (insulin-independent) DeGlc uptake (2.8-fold, **p = 0.0002) and impairs the response to an acute insulin addition (reduced to 1.6-fold; #p = 0.0013). The maximal rate of insulin stimulated DeGlc transport was reduced under hyperinsulinemia (from 394 pmol/min/million cells to 218 pmol/mon/million cells; ***p < 0.0001). Data shown is from 4 independent experiments; statistical analysis by one-way ANOVA. We used 3T3-L1 adipocytes expressing HA-GLUT4-GFP to measure GLUT4 plasma membrane density (B) and GLUT4 dispersal (C) under the same conditions. (B) Insulin increased GLUT4 density in the plasma membrane 2.7-fold (*p < 0.0001) in control cells. In chronic insulin treated cells, the ability of insulin to increase GLUT4 levels was reduced (1.5-fold, **p = 0.044); each point is a measurement from a single cell. The maximal GLUT4 density in response to insulin was reduced in chronic insulin treated cells (***p = 0.03). (C) shows estimates of L(r) under basal and insulin-stimulated conditions in control and hyperinsulinemia conditions as previously described. Chronic insulin treated cells and control cells in the absence of insulin exhibited no difference in L(r) distribution (ns on figure; p = 0.86 determined by one-way ANOVA, Tukey’s HSD Test). Acute insulin stimulation resulted in GLUT4 dispersal in both control and chronic insulin-treated cells. However, chronic insulin treated cells exhibited reduced GLUT4 dispersal in response to an acute insulin challenge compared to that observed in control cells (*p = 0.0061 determined by one-way ANOVA, Tukey’s HSD Test).

