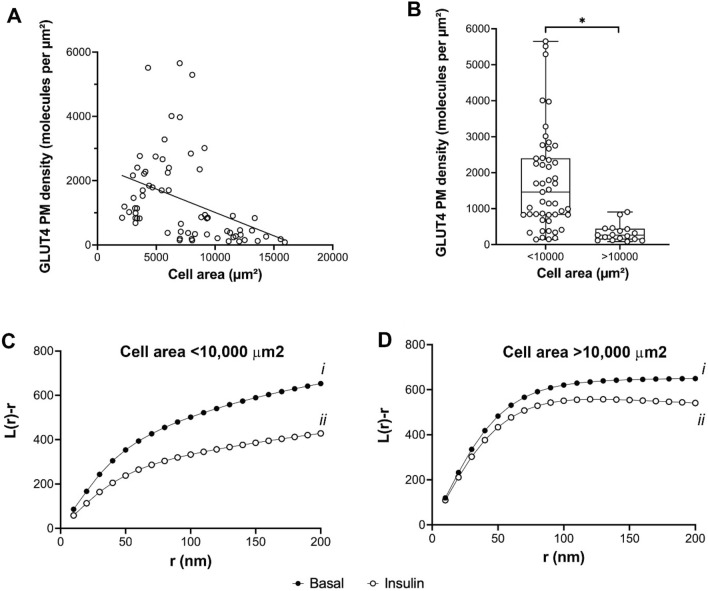
Figure 4.
GLUT4 translocation and dispersal in adipocytes of different sizes. dSTORM datasets were used to quantify cell surface GLUT4 density in cells incubated with or without 100 nM insulin for 20 min as outlined, and the data sorted on the basis of cell size. (A) shows the relationship of GLUT4 density to cell area in insulin-stimulated cells (100 nM, 20 min). Each point is a single cell, and the data was collected from 70 to 150 cells analysed from 3 independent experiments. (B) shows the same data sorted into cells of area less than or greater than 10,000 μm2. *Indicates a statistically significant difference between the groups, p = 0.001. Each point is a measurement from a single cell. (C) and (D) show estimates of L(r) under basal and insulin-stimulated conditions separated on the basis of cell size. (C) shows that in cells of area < 10,000 μm2, L(r) peaks at higher values for basal cells indicating more GLUT4 is found clustered at closer distances compared to insulin-stimulated cells (p = 0.008 for curves i versus ii).), consistent with insulin-stimulated GLUT4 dispersal (see text). (D) indicates the ability of insulin to promote dispersal is significantly impaired in larger cells (p = 0.132 for curves i versus ii). Analysis of the basal distribution shows no significant difference between smaller and larger cells (Ci vs. Di, p = 0.121), but a significant difference in insulin-stimulated distribution (Cii versus Dii, p < 0.0001). All statistical comparisons were determined by unpaired two-samples t-test.

