
FIGURE 3.
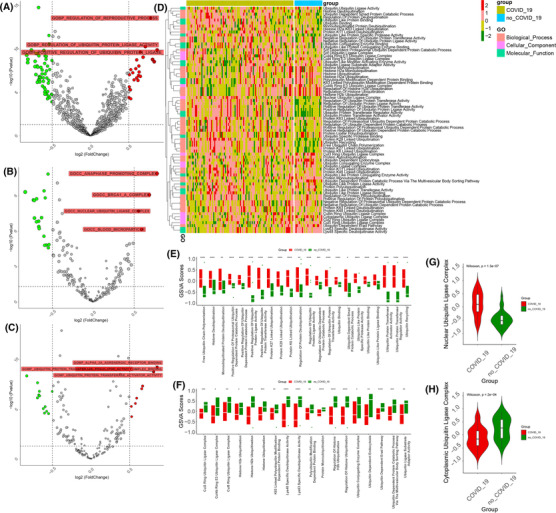
Ubiquitin pathway profiles of peripheral blood mononuclear cells in coronavirus disease 2019 (COVID‐19) patients. (A–C) The volcano plot shows the up‐ and downregulated biological processes, cellular components, and molecular functions in the blood leukocytes of COVID‐19 and non‐COVID‐19 patients. Red: upregulation, green: downregulation. (D) The heatmap (z‐scored by row) shows all ubiquitin‐associated pathways in the blood leukocytes of COVID‐19 and non‐COVID‐19 patients. The annotation of the vertical axis is the biological procession, cellular component, and molecular function. (E,F) The boxplot plot shows the up‐ and downregulated ubiquitin‐associated pathways in the blood leukocytes of COVID‐19 patients by t‐test. (G) The violin plot shows the difference in the nuclear ubiquitin ligase complex in the blood leukocytes of COVID‐19 and non‐COVID‐19 patients by the Wilcoxon test (p = 1.4e‐0.7). (H) The violin plot shows the difference in the cytoplasmic ubiquitin ligase complex in the blood leukocytes of COVID‐19 and non‐COVID‐19 patients by the Wilcoxon test (p = .00024). (****: p < .0001, ***: p < .001, **: p < .01, *: <.05)