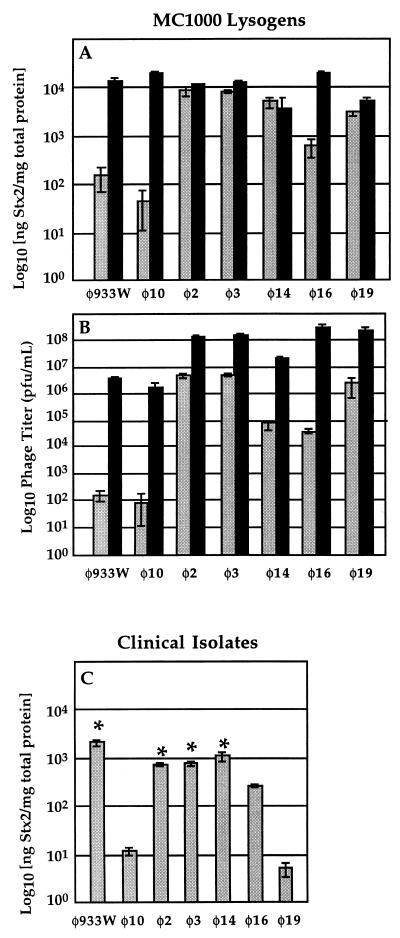
FIG. 2.
(A) Toxin production in the presence (black bars) or absence (gray bars) of mitomycin C (0.5 μg/ml) by MC1000 lysogens of the phages indicated. (B) Phage production in the presence (black bars) or absence (gray bars) of mitomycin C by MC1000 lysogens of the phages indicated. (C) Toxin production in the absence of mitomycin C by the clinical isolates from which the indicated phages were obtained. ∗, O157:H7 clinical isolates. Mean values are shown along with standard deviations derived from three independent trials.

