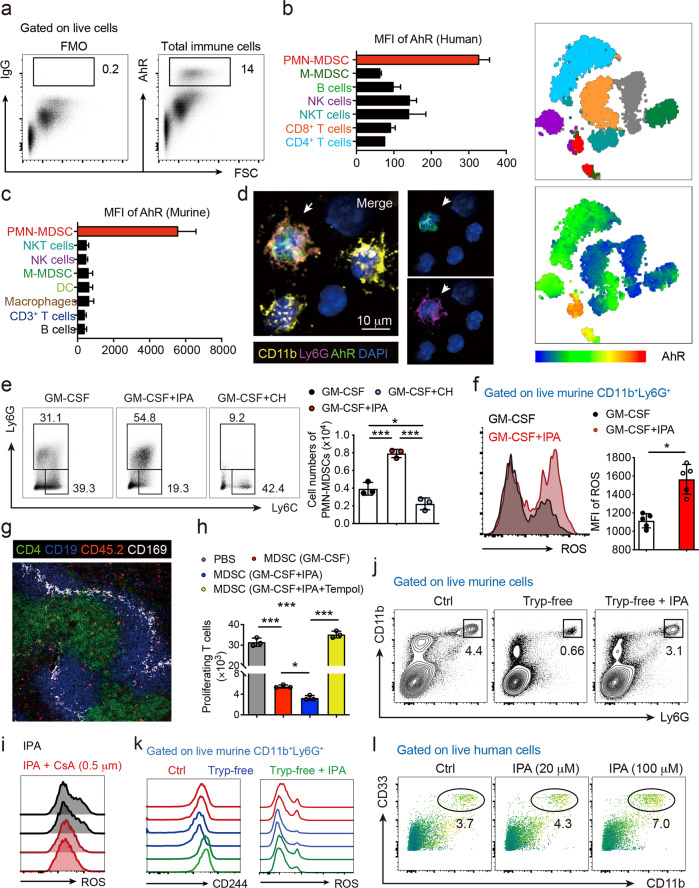
Fig. 1.
AhR activation promotes the PMN-MDSC response. a Representative flow cytometric analysis was performed to analyze the intranuclear staining of AhR in PBMCs from healthy donors. b, c t-SNE plot and mean fluorescence intensity (MFI) of AhR expression among various immune cell subsets from both humans and mice, showing that AhR was highly and predominantly expressed in PMN-MDSCs (n = 3). d Representative images of murine PMN-MDSCs visualized by fluorescence microscopy to detect intracellular AhR staining (n = 5). e Murine bone marrow cells were isolated and cultured under MDSC polarization conditions for 3 days in the presence or absence of IPA and CH223191 (n = 3 in each group), and the frequency and number of PMN-MDSCs were analyzed. f ROS production by splenic PMN-MDSCs was measured by analyzing the fluorescence intensity of DCFH-DA (n = 5). g CD45.2+ PMN-MDSCs were adoptively transferred to congenic CD45.1+ mice. Representative image showing that within white pulp (marked by CD169, white), CD45.2+ PMN-MDSCs (red) appeared mainly in the CD4+ T-cell zones (green) and T-B borders in the spleen. h Murine bone marrow cells were isolated and cultured under MDSC polarization conditions in the presence or absence of IPA for 3 days. PMN-MDSCs were sorted, purified, and cocultured with CFSE-labeled CD4+ T cells with or without the ROS scavenger Tempol. T-cell proliferation was determined by measuring the CFSE fluorescence intensity by flow cytometry (n = 3). i IPA and NADPH oxidase inhibitor cyclosporin A (CsA) were cotreated with MDSCs upon polarization, and intracellular ROS production was detected by flow cytometry. j, k The frequencies of splenic PMN-MDSCs were analyzed by flow cytometry in mice fed a normal diet (Ctrl) and tryptophan-free diet with or without IPA supplementation for 2 weeks (j), and the MFI values of CD244 and ROS were determined (m) (n = 5). l PBMCs from healthy donors were polarized toward MDSC in the absence or presence of IPA for 6 days, and CD33+CD11b+CD66b+ PMN-MDSCs were analyzed (n = 3). Data were derived from at least three independent experiments. Data were presented as the mean ± SD. ns, not significant. *P < 0.05, **P < 0.01, and ***P < 0.001

