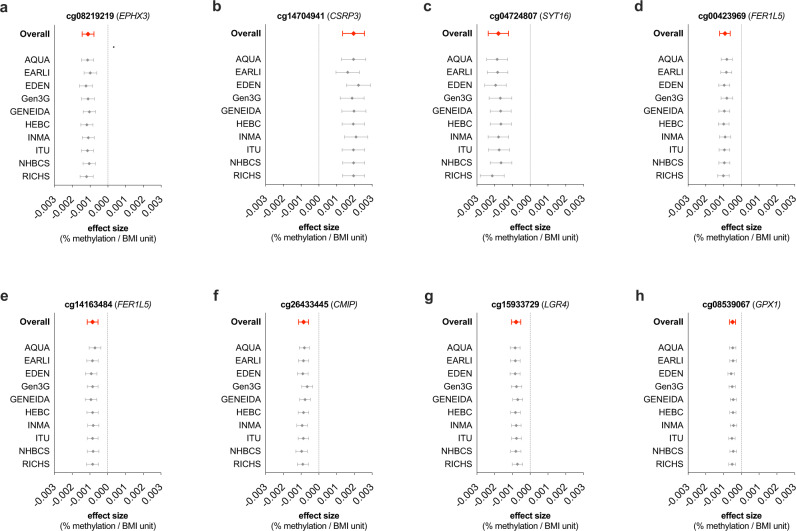
Fig. 3. Forest plots of the leave-one-out analysis showing the fixed effects meta-analysis estimates of association between maternal ppBMI and placental DNAm.
Association of a cg08219219, b cg14704941, c cg04724807, d cg00423969, e cg14163484, f cg26433445, g cg15933729, h and cg08539067 with maternal ppBMI. In all panels, cohort names indicate the cohort excluded in each row, and error bars represent the 95% confidence interval of the effect size. Numerical source data for the figure are available in file Supplementary Data 9.

