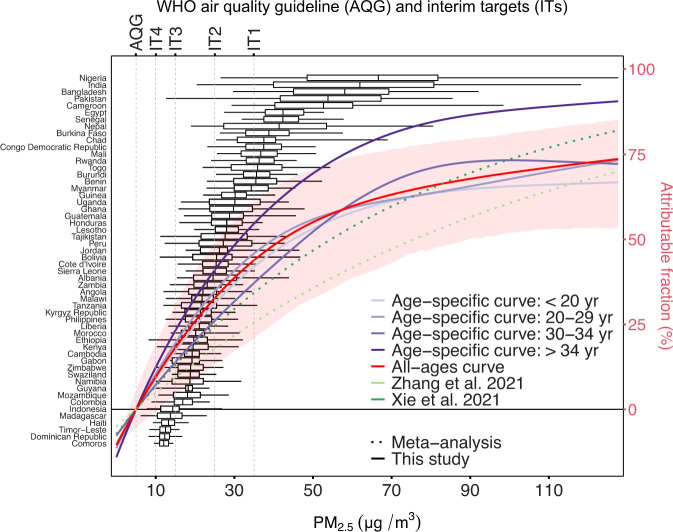
Fig. 2. Multiple exposure–response curves to link PM2.5 with stillbirth (right y-axis).
The all-ages curve and age-specific curves were derived from our self-matched case-control study of stillbirths from 54 countries (left y-axis). The corresponding PM2.5 exposures in those countries are shown as boxplots (The centre bars are medians; the box bounds and whiskers indicate for ranges from 25th to 75th and from 2.5th to 97.5th percentile, respectively.). The red ribbon is the pointwise 95% confidence interval for the all-ages curve.

