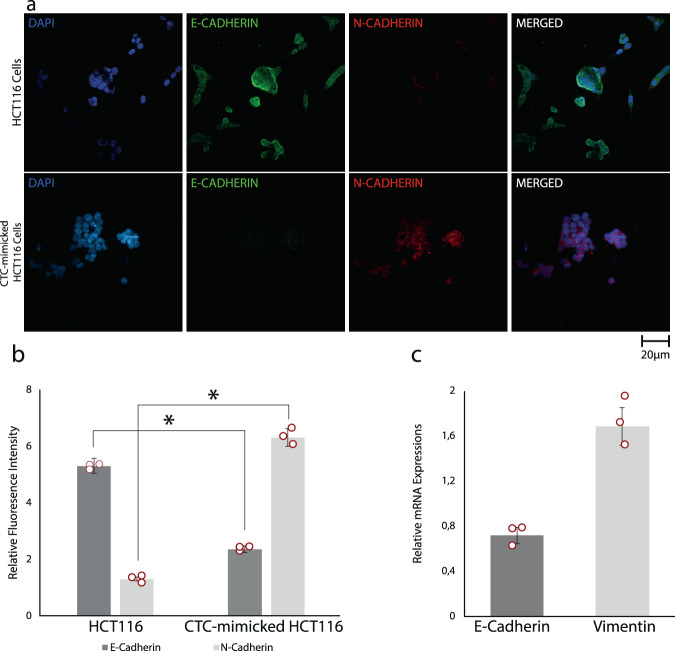
Fig. 5. Validation of mesenchymal character induced by TGF-β treatment.
a Fluorescence immunocytochemistry staining for DAPI (blue), E-cadherin (green), and N-cadherin (red) on HCT116 and CTC-mimicking HCT116 cells, respectively. E-cadherin is down regulated whereas N-cadherin is upregulated in CTC-mimicking cells. Scale bar 20 µm. b Bar graphs demonstrating the intensity of expressed E-cadherin and N-cadherin. Quantification of fluorescence intensities from arbitrary images of each condition was done with ImageJ software (NIH, Bethesda, MD, USA). c E-cadherin and vimentin mRNA expression relative to housekeeping gene GAPDH by value calculation. E-cadherin expression was decreased 0.7-times and vimentin expression was increased 1.7-times after TGF-β treatment for 48 h. All data in b and c are expressed as mean ± S.D. (standard deviation) for data collected in n = 3 over three independent experiments and star (*) indicates p < 0.05 obtained via unpaired Student’s t test.

