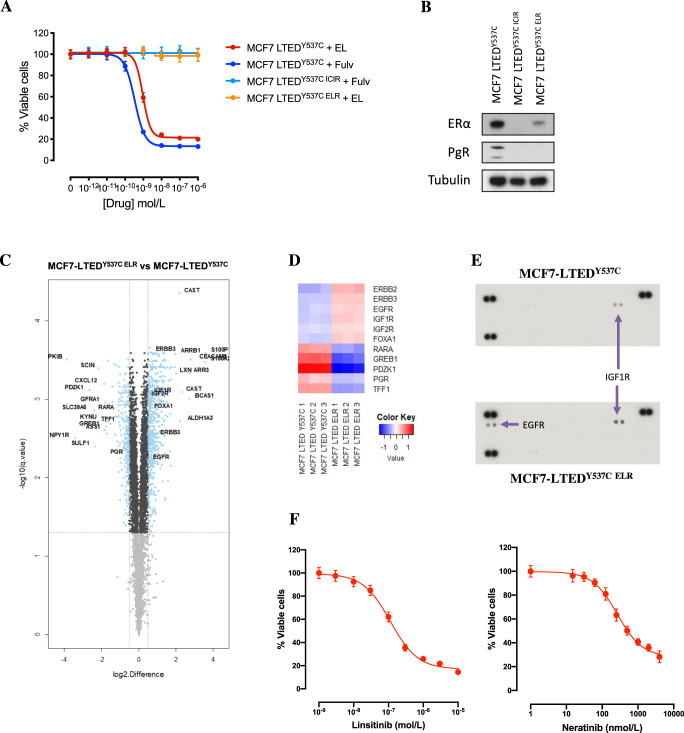
Fig. 7. Mechanisms of resistance to elacestrant.
A Effect of escalating concentrations of fulvestrant and elacestrant on the proliferation of MCF7-LTEDY537C and its corresponding derivatives fulvestrant (ICIR) and elacestrant (ELR) resistant cell lines. Data represents % viable cells compared to vehicle control for each cell line. Error bars represent mean ± SEM (n = 3 biological experiments with six technical replicates). B Immunoblotting showing ER and PGR abundance (data representative of n = 3 biological replicates). C Volcano plot showing significant up- and downregulated proteins (blue) in MCF7-LTEDY537C ELR cells in relation to the parental cell line (data generated from n = 3 biological replicates). Top significant proteins, E-regulated targets and growth factors are highlighted. D Heatmap representation of the protein expression of E-regulated targets, ER modulators and growth factors in MCF7-LTEDY537C parental versus MCF7-LTEDY537C ELR. E Reverse phase protein arrays assessing receptor tyrosine kinase expression. F Effect of escalating concentrations of linsitinib and neratinib on the proliferation of MCF7-LTEDY537C ELR cell lines. Data represents % viable cells compared to vehicle control for each cell line. Error bars represent mean ± SEM.

