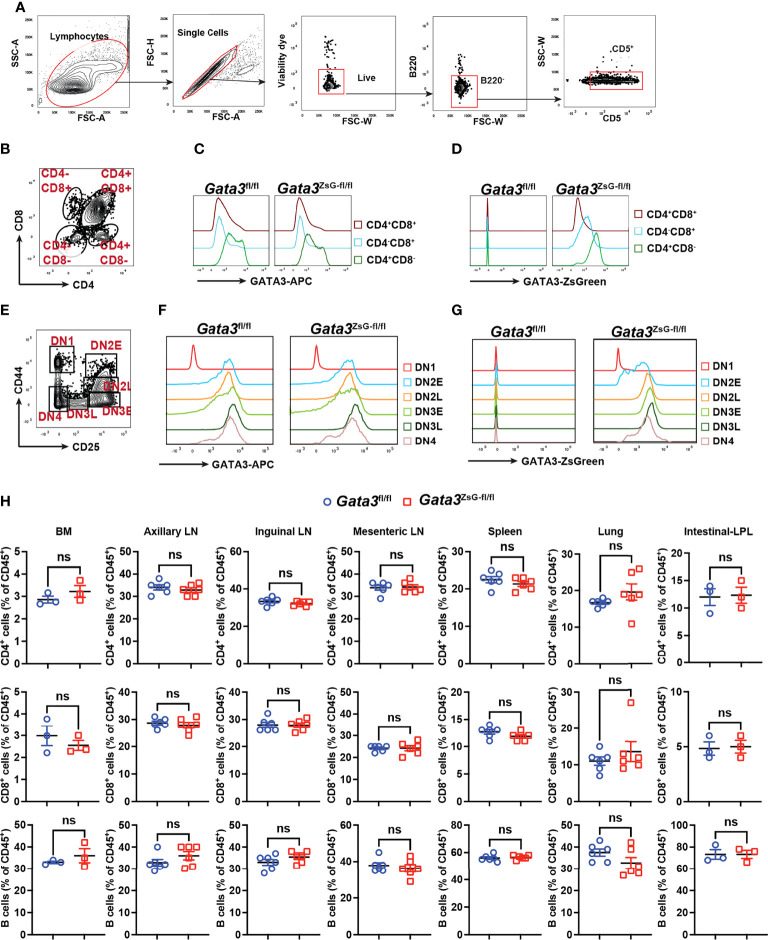
Figure 2.
Normal thymic development in the Gata3 ZsG-fl/fl mice. Thymocytes from Gata3 fl/fl and Gata3 ZsG-fl/fl mice were stained and analyzed by flow cytometry. (A) Gating strategy for distinguishing T cells from other cell population. (B) Gating strategy for analyzing different developmental stages of T lymphocytes. (C) Flow cytometric histograms showing GATA3 protein expression in CD4 and CD8 single or double positive lymphocytes. (D) ZsGreen expression in CD4 and CD8 single or double positive lymphocytes. (E) Gating strategy for analyzing different stages of CD4 and CD8 double negative (DN) cells. (F) Flow cytometric histograms showing GATA3 protein expression in DN cells at various developmental stages. (G) ZsGreen expression in DN cells at various developmental stages. (H) Distribution analysis of CD4+ T cells, CD8+ T cells, and B cells in various lymphoid organs and tissues based on flow cytometry data (Mean ± SEM; ns, not significant; Student t-test) . Results are representative of two independent experiments.

