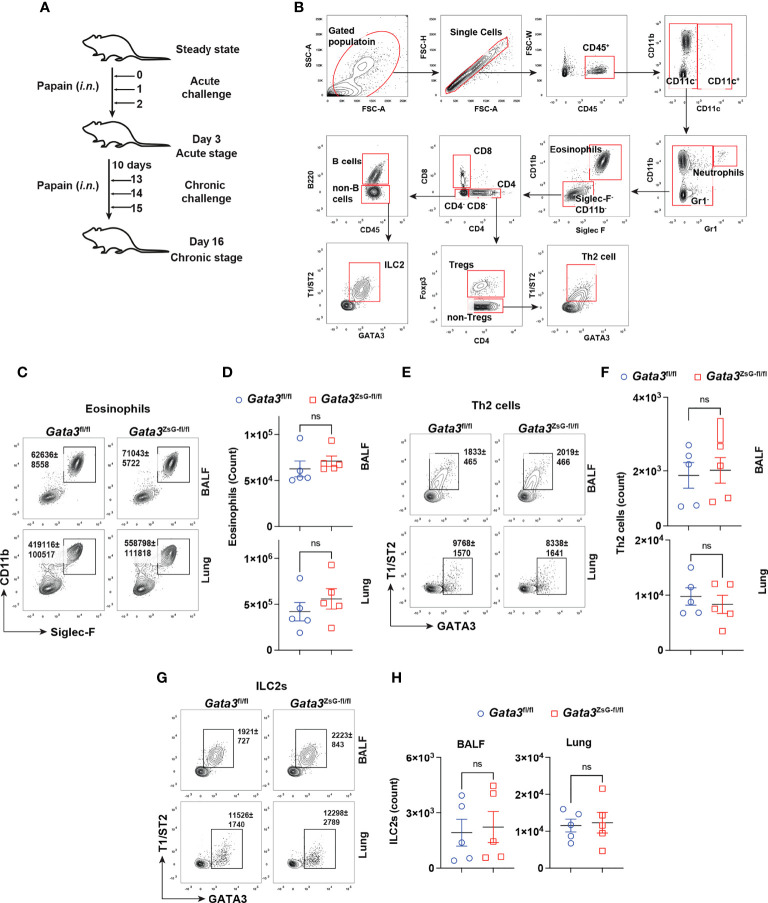
Figure 3.
Normal development of ILC2s and Th2 cells in the Gata3 ZsG-fl/fl mice. (A) Schematic representation of the mouse model of airway inflammation induced by chronic papain i.n. challenges. (B) Gating strategy for analyzing eosinophils, Th2 cells, and ILC2s from BALF and lung. (C) Gata3 fl/fl and Gata3 ZsG-fl/fl mice were challenged with papain followed by flow cytometric analysis of eosinophilic infiltration in BALF and lung. (D) The total numbers of eosinophils in lung in C were counted and plotted (Mean ± SEM; n = 5; ns = not significant, Student t-test). (E) Th2 cells in BALF and the lung were identified by flow cytometry. (F) The total numbers of Th2 cells in E were counted and plotted (Mean ± SEM; n = 5; ns, not significant, Student t-test). (G) ILC2s in BALF and the lung were identified by flow cytometry. (H) The total ILC2s in G were counted and plotted (Mean ± SEM; n = 5; ns, not significant, Student t-test). Results are representative of two independent experiments.

