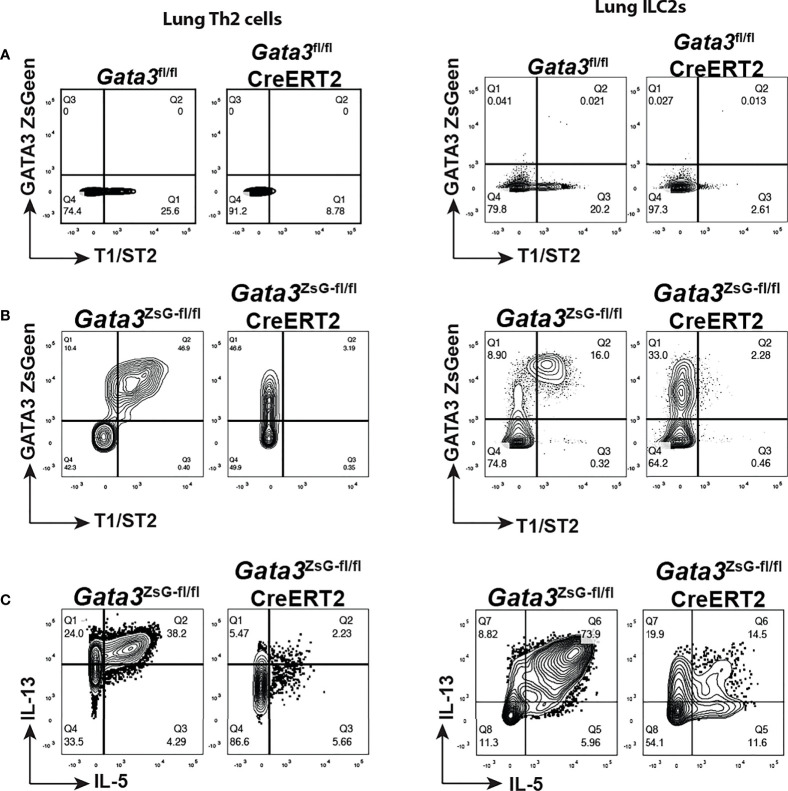
Figure 6.
GATA3 KO “Th2” cells and “ILC2s” are identifiable in the Gata3 ZsG-fl/flCreERT2 mice. Mice were challenged with papain as shown in Figure 3A and injected (i.p.) with tamoxifen on day 14. The mice were euthanized on day 16 to analyze ILC2 and Th2 cell responses. (A) Gata3 fl/fl and Gata3 fl/fl CreERT2 mice were challenged with papain and injected with tamoxifen followed by flow cytometric analysis of Th2 cells (left panel) and ILC2s (right panel) in lung. (B) Gata3 ZsG-fl/fl, and Gata3 ZsG-fl/fl CreERT2 mice were challenged with papain and injected with tamoxifen followed by flow cytometric analysis of Th2 cells (left panel) and ILC2s (right panel) in lung. (C) Flow cytometric analysis of IL-5 and IL-13-expressing Th2 cells (left panel) and ILC2s (right panel) among the ZsGreen+ cells from the Gata3 ZsG-fl/fl and Gata3 ZsG-fl/flCreERT2 mice challenged with papain and injected with tamoxifen. Results are representative of two independent experiments.

