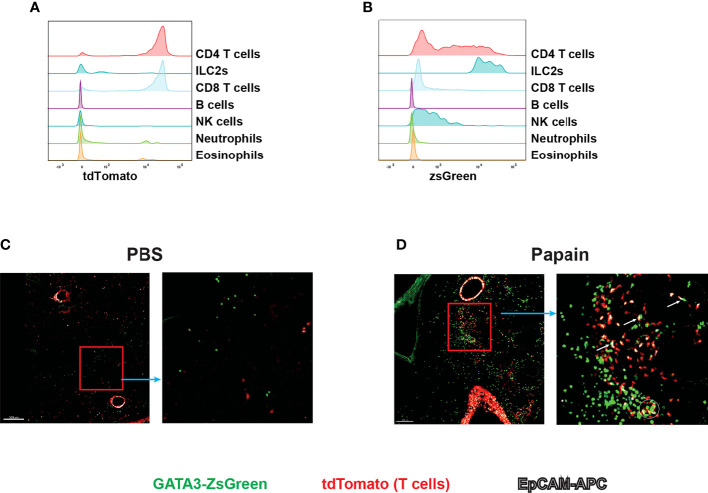
Figure 8.
Live imaging of Th2 cells and ILC2s with Gata3 ZsG/+ Cd4 Cre R26 tdTomato Gata3 ZsG/+ Cd4 Cre R26 tdTomato mice were chronically challenges with papain and lung tissues were sliced and visualized by confocal microscopy. The green fluorescence expressing cells represents the ZsGreen-expressing ILC2s. The red fluorescence expressing cells represents the total T cells population. The colocalization of green and red fluorescent cells represent Th2 cells indicated by orange color. The white fluorescence represents the EpCAM stained cells. (A) Flow cytometry histogram represents the fate mapping marker tdTomato expression among various lymphoid and myeloid population in the lung tissue. (B) ZsGreen expression analysis by flow cytometry across various lymphoid and myeloid population. (C) Confocal microscope image of lung tissue slice isolated from PBS challenged mice show the distribution of ILC2s and T cell population. The highlighted part of the image was enlarged and showed beside the main image. (D) Confocal microscope image of lung tissue slice isolated from papain challenged mice show the distribution of ILC2s and T cell population. The highlighted part of the image was enlarged and showed on the right. Several potential interactions between ZsGreenhitdTomatoneg cells (ILC2s) and ZsGreenhitdTomato+ (Th2) cells were indicated by a circle and arrows in the enlarged image. Results are representative of two independent experiments.

