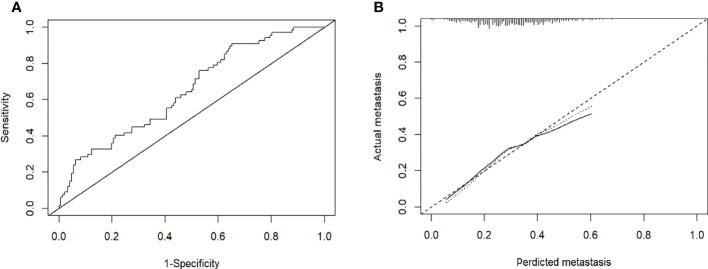
Figure 4.
(A): Receiver operating characteristic curves for EHM of the patients in the training cohort. The receiver operating characteristic curves at the initial diagnosis are shown, and its area ROC curves are provided. (B): Calibration plots of EHM in the training cohorts. The calibration curves derived from the training cohorts are almost a diagonal line that would represent perfectly reliable prediction.

