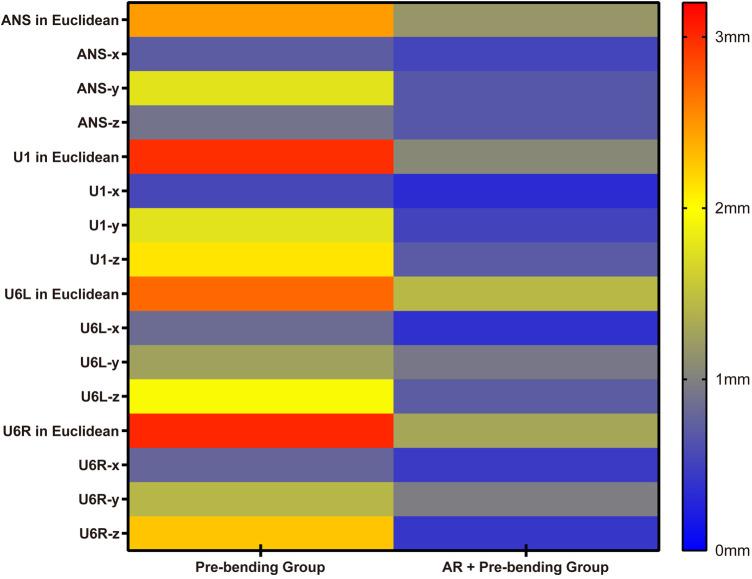
Figure 6.
Differences between the two groups in linear deviations of the distraction result note: ANS in Euclidean, ANS-x, ANS-y, and ANS-z, respectively, represented the linear deviation in Euclidean distance, x, y, and z-axes of landmark ANS. U1 in Euclidean, U1-x, U1-y, and U1-z, respectively, represented the linear deviation in Euclidean distance, x, y, and z-axes of landmark U1. U6l in Euclidean, U6l-x, U6l-y, and U6l-z, respectively, represented the linear deviation in Euclidean distance, x, y, and z-axes of landmark U6l. U6R in Euclidean, U6R-x, U6R-y, and U6R-z, respectively, represented the linear deviation in Euclidean distance, x, y, and z-axes of landmark U6R. The vertical gradient color strip located on the right side of the figure shows the color represented in distance error levels, from 0 mm (blue) to 3.2 mm (red), and the baseline is 2 mm (yellow), which represents clinically acceptable error.

