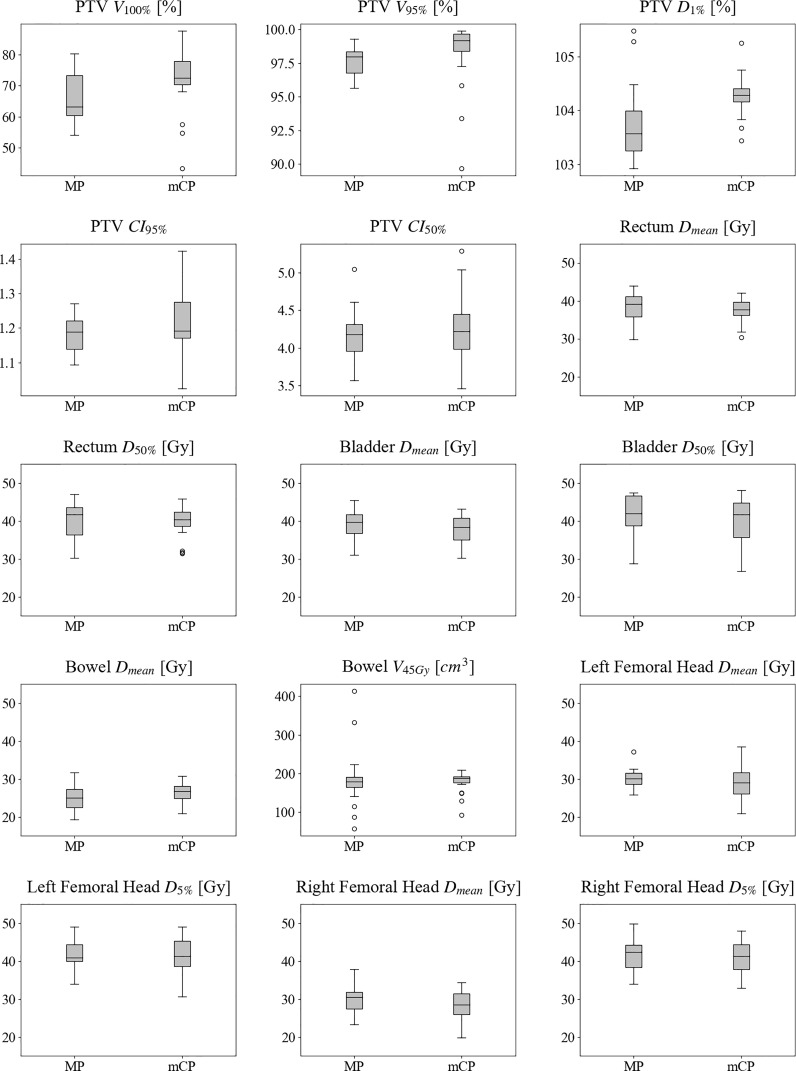
Figure 2.
Box-and-whisker plots of computed dosimetric metrics for manual plans and mCycle plans. The box is delimited by the first (25%) and the third (75%) quartiles, and the bold line represents the median value. The whiskers point to the minimum and maximum data without counting boxplot outliers that in case there exist are represented with circles. An outlier is defined as a value exceeding the 1.5 interquartile range [1.5 (third–first quartile)]. MP, manual plans; mCP, mCycle plans; PTV, planning target volume; V#, volume receiving more than # Gy; D#, dose received by the # % of contoured volume; CI#, conformality index of the # dose; Dmean, mean dose.

