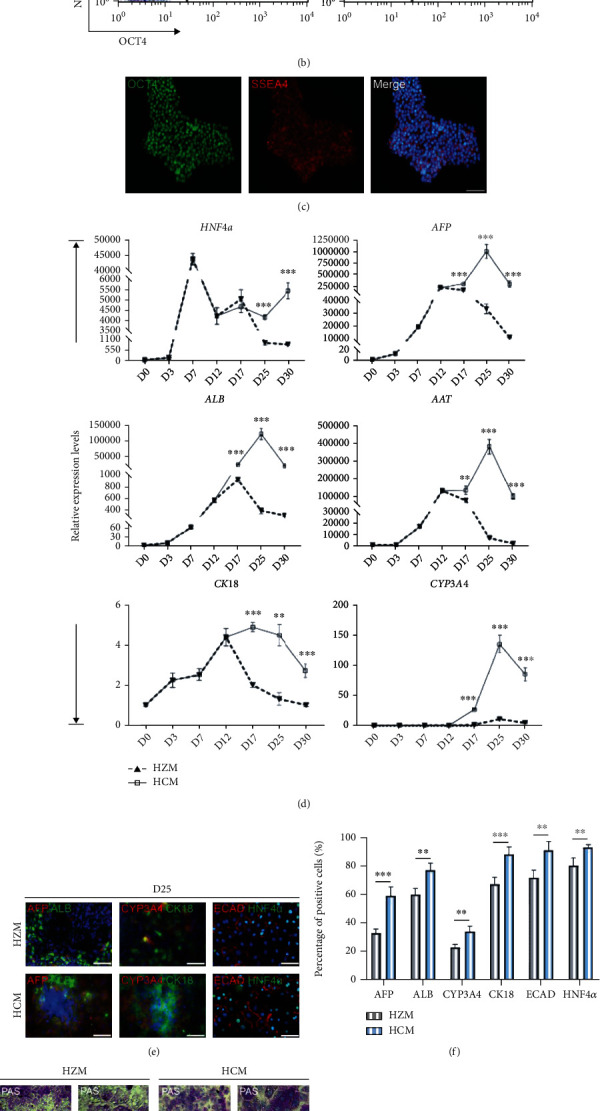
Figure 1.

Screening of an optimal culture medium for maintenance of hiPSC-derived hepatocytes. (a) Workflow representation of the differentiation procedure. Sequential morphological changes (day 0-25) of hiPSC differentiation into hepatocytes. Scale bars, 50 μm. (b) Flow cytometry showed the coexpression of NANOG and OCT4 about 97% in day 0 hiPSCs. (c) Immunofluorescence showed the coexpression of SSEA4 and OCT4 in the most of day 0 hiPSCs. Scale bars, 50 μm. (d) Quantitative PCR analysis showed significantly higher expression of mature hepatocyte markers over differentiation in the HCM group when compared with the HZM group. ∗p < 0.05, ∗∗p < 0.01, ∗∗∗p < 0.001, and n = 3. (e, f) Immunofluorescence showed the coexpression of mature hepatocyte markers in day 30 cells, respectively. Scale bars, 50 μm. ∗p < 0.05, ∗∗p < 0.01, ∗∗∗p < 0.001, and n = 3. (g) Hepatocytes performed periodic acid-Schiff staining (PAS; top), Oil Red O staining (ORO; middle), and indocyanine green uptake/release analysis (ICG; bottom). Scale bars, 25 μm. (h) Bright field images showed the morphological changes of hepatocytes in HCM and HZM (days 35-45). Scale bars, 25 μm. (i) Bright field images of senescence β-Gal staining in hepatocytes during days 35-45. Scale bars, 25 μm.
