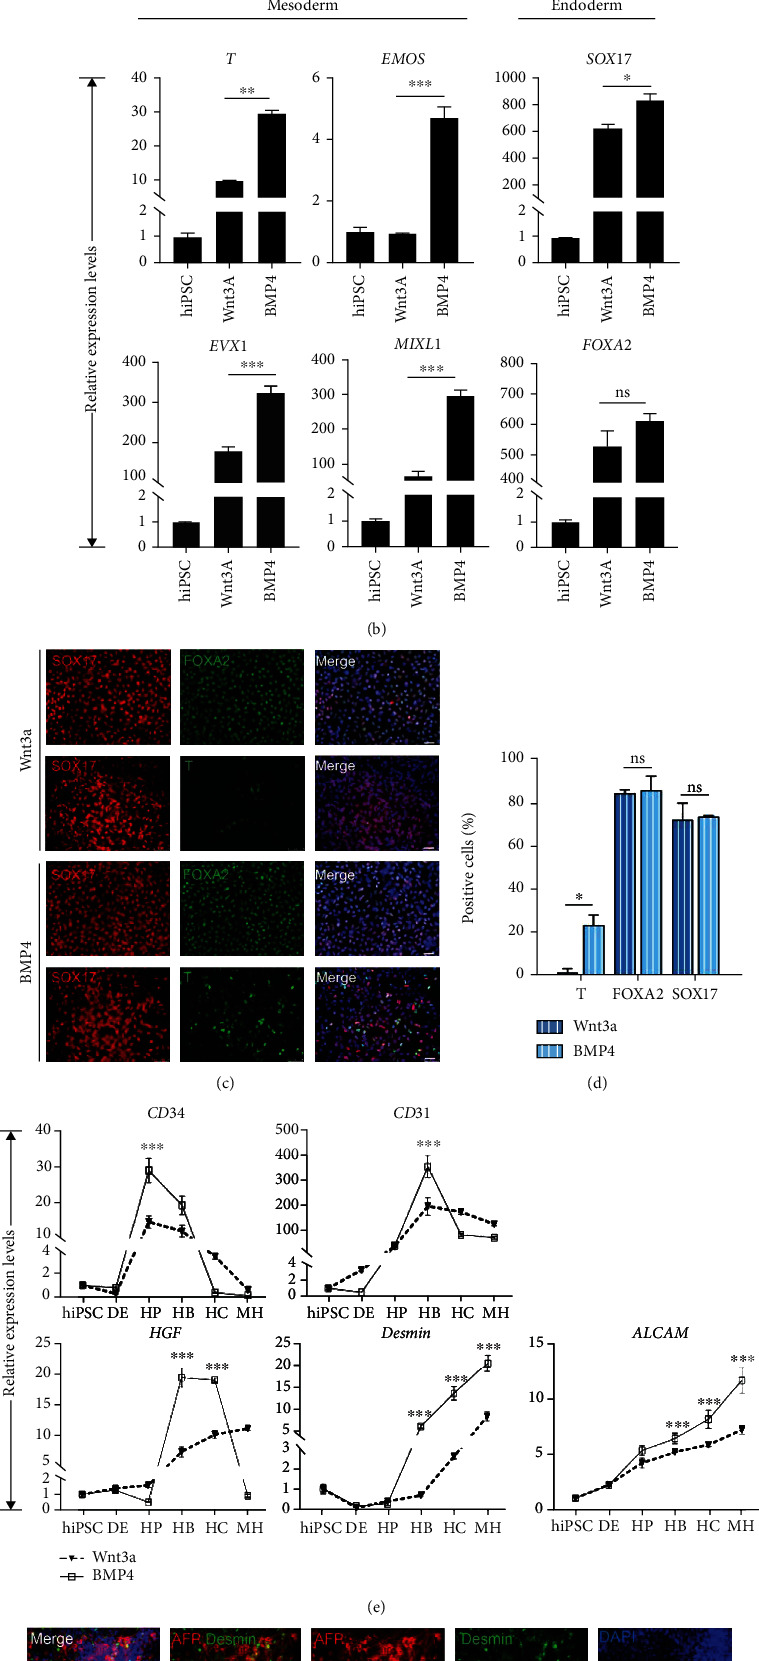
Figure 2.

Codifferentiation of hepatocytes and nonparenchymal cells. (a) Schematic representation of the hepatocyte differentiation procedure during day 0 to day 30. The bright field images showed the sequential morphological changes (days 0-30) of hiPSC differentiation into hepatocytes. Scale bars, 50 μm. (b) Quantitative PCR analysis and immunofluorescence (c, d) showed that addition of BMP4 into endoderm medium resulted in main endoderm and a small part mesoderm commitment. Scale bars, 50 μm. ∗p < 0.05, ∗∗p < 0.01, ∗∗∗p < 0.001, and n = 3. (e) Quantitative PCR analysis showed endothelial cell marker gene expression levels during hepatocyte differentiation. ∗p < 0.05, ∗∗p < 0.01, ∗∗∗p < 0.001, and n = 3. (f) Immunofluorescence image showed endothelial cells in hepatic progenitors and hepatoblast stage in the BMP4 group. Scale bars, 50 μm.
