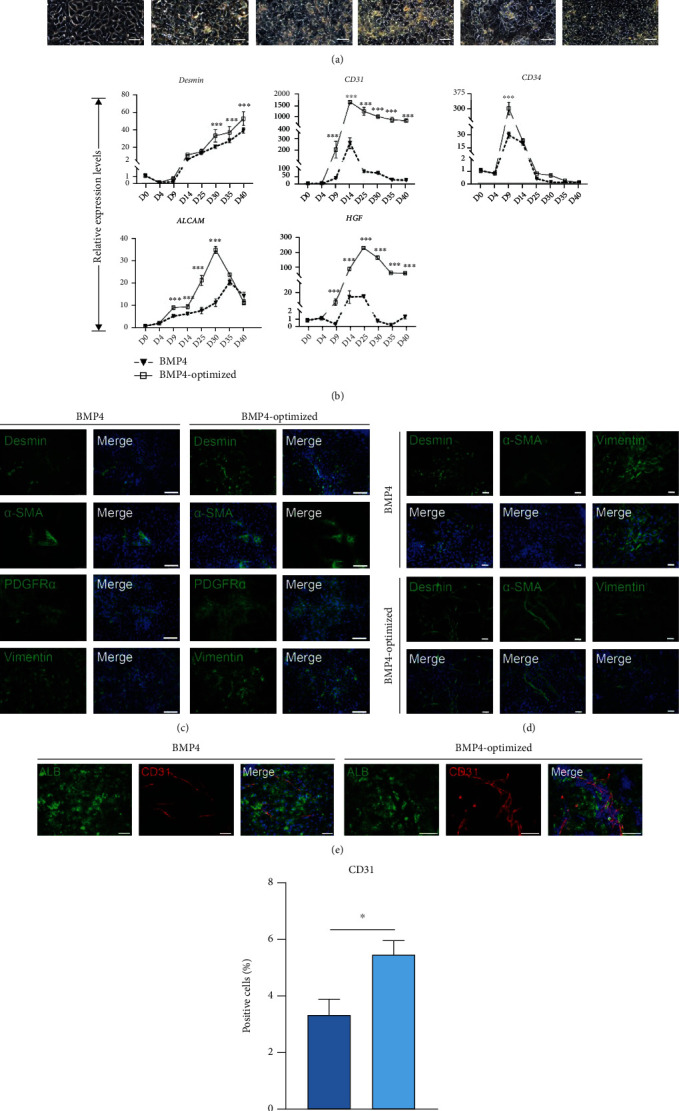
Figure 4.

Optimization of the BMP4 differentiation protocol significantly promotes nonparenchymal cell production. (a) Schematic representation of the hepatocyte differentiation procedure during day 0 to day 30. The bright field images showed the sequential morphological changes (days 0-30) of hiPSC differentiation into hepatocytes. Scale bars, 50 μm. (b) Quantitative PCR analysis showed the expression levels of endothelial lineage markers. ∗p < 0.05, ∗∗p < 0.01, ∗∗∗p < 0.001, and n = 3. Immunofluorescence showed the differentiation of hiPSC-derived endothelial lineage in day 9 (c) and day14 (d). Scale bars, 50 μm. (e, f) Immunofluorescence results showed expression CD31 in both differentiation protocols. Scale bars, 75 μm. ∗p < 0.05, ∗∗p < 0.01, ∗∗∗p < 0.001, and n = 3.
