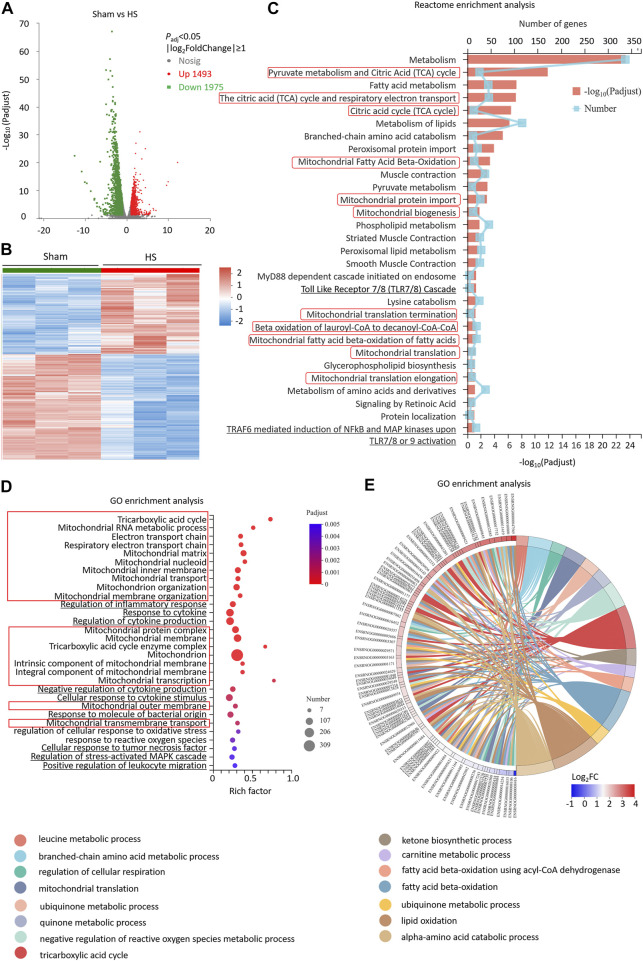
FIGURE 2.
Differentially expressed genes of myocardial tissues after HS are significantly enriched in mitochondrial and ROS pathways. (A) The volcano plot showing number of differentially expressed genes (DEGs) of HS and sham rat heart tissues; P adj < 0.05, n = 3 rats per group. (B) A heat map summary of the DEGs expression values of HS and sham group. Red indicates high and green indicates low gene expression P adj < 0.05, n = 3 mice per group. (C) Reactome enrichment analysis and (D) GO enrichment analysis of all the DEGs and GO cluster plot showing a chord dendrogram (E) of the clustering of the expression spectrum of the 309 DEGs in the mitochondrion GO term between sham and HS.

