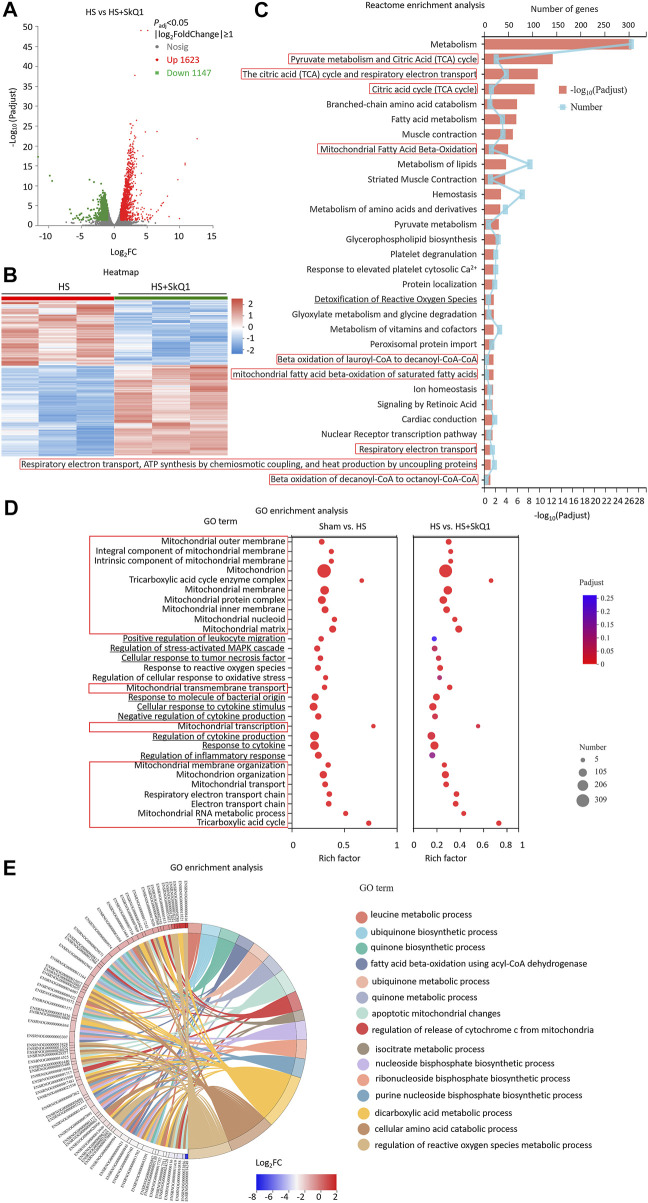
FIGURE 5.
SkQ1 treatment after HS causes DEGs of myocardial tissues enriched in the mitochondrial and ROS-related pathways. (A) The volcano plot showing number of differentially expressed genes (DEGs) of HS + SkQ1 and HS rat heart tissues; P adj < 0.05, n = 3 rats per group. (B) A heat map summary of the DEGs expression values of HS + SkQ1 and HS group. Red indicates high and green indicates low gene expression P adj < 0.05, n = 3 mice per group. (C) Reactome enrichment analysis and (D) GO enrichment analysis of all the DEGs and GO cluster plot showing a chord dendrogram (E) of the clustering of the expression spectrum of the 278 DEGs in the mitochondrion GO term between HS + SkQ1 and HS.

