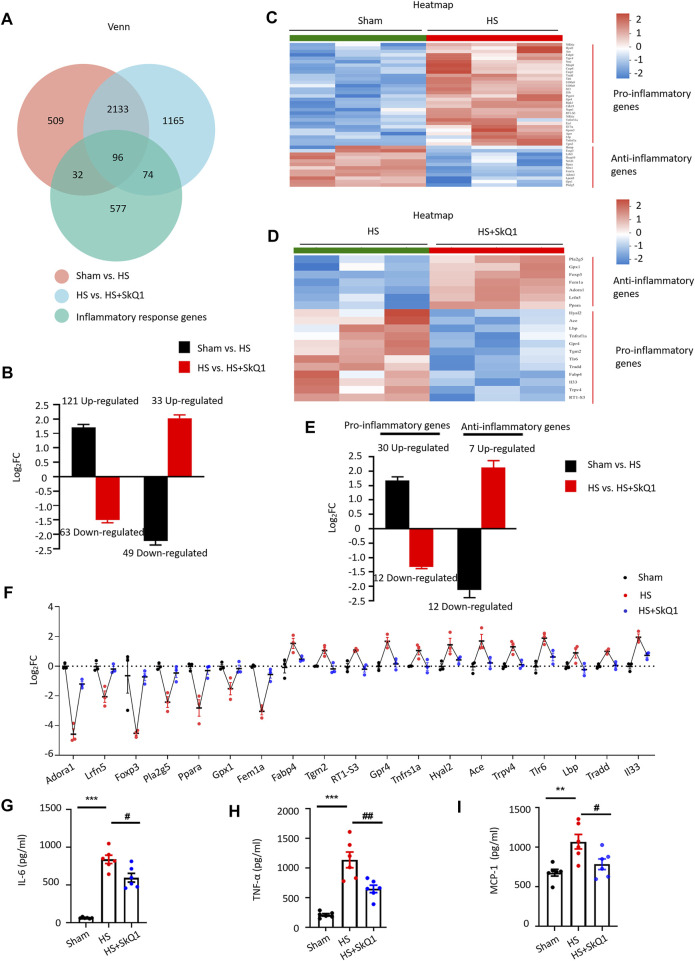
FIGURE 6.
SkQ1 improves inflammatory response after HS. (A) Venn diagram of the inflammatory response DEGs in the sham vs. HS and in the HS + vehicle vs. HS + SkQ1 group; the expressions of 96 inflammatory genes were reversed by SkQ1. (B) Statistical results of the average expression of inflammatory response genes. The black column chart shows the changes in inflammatory gene expression in the HS vs. sham group. The red column chart shows the changes in inflammatory gene expression in the HS + SkQ1 vs. HS + vehicle group; n = 3 mice per group; log2FC > 0 indicates gene expression increased, and log2FC < 0 indicates gene expression decreased. (C) Hierarchical cluster analysis heatmap of myocardial proinflammatory and anti-inflammatory response DEGs in the sham and HS group. (D) Hierarchical cluster analysis heatmap of the myocardial proinflammatory and anti-inflammatory response DEGs in the HS + vehicle and HS + SkQ1 group. (E) Average expression of proinflammatory and anti-inflammatory response genes: The black column chart shows the changes in inflammatory gene expression in the HS vs. sham group. The red column chart shows the changes in inflammatory gene expression in the HS + SkQ1 vs. HS + vehicle group; (F) Statistical results of the 7 anti-inflammatory and 12 pro-inflammatory genes change in the sham, HS, and HS + SkQ1 groups; n = 3 mice per group; log2FC > 0 indicates gene expression increased, and log2FC < 0 indicates gene expression decreased. (G–I) Statistical results of the protein expression of proinflammatory factors, TNF-α, IL-6, and MCP-1 in blood determined through ELISA; n = 6 mice per group; ** p < 0.01, *** p < 0.001 vs. sham + vehicle group; # p < 0.05, ## p < 0.01 vs. HS + vehicle group.

