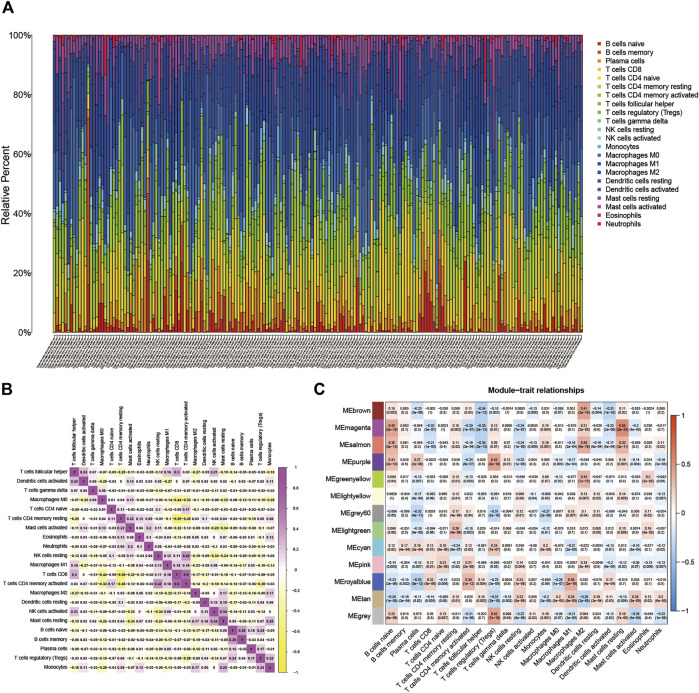
FIGURE 1.
(A) Subpopulation of 22 immune cells. (B) The intrinsic correlation between 22 immune cells. (C) Heatmap of correlation between modules and TICs. Within every square, the number on the top refers to the coefficient between the cell infiltrating level and the corresponding module, and the bottom is the p-value.

