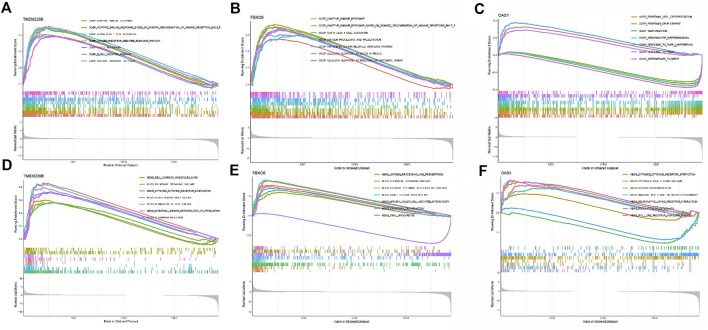
FIGURE 3.
(A) The enriched gene sets in GO collection by the high TMEM229 expression sample. (B) The enriched gene sets in GO collection by the high FBXO6 expression sample. (C) The enriched gene sets in GO collection by the high OAS1 expression sample. (D) The enriched gene sets in KEGG collection by the high TMEM229 expression sample. (E) The enriched gene sets in KEGG collection by the high FBXO6 expression sample. (F) The enriched gene sets in KEGG collection by the high OAS1 expression sample.

