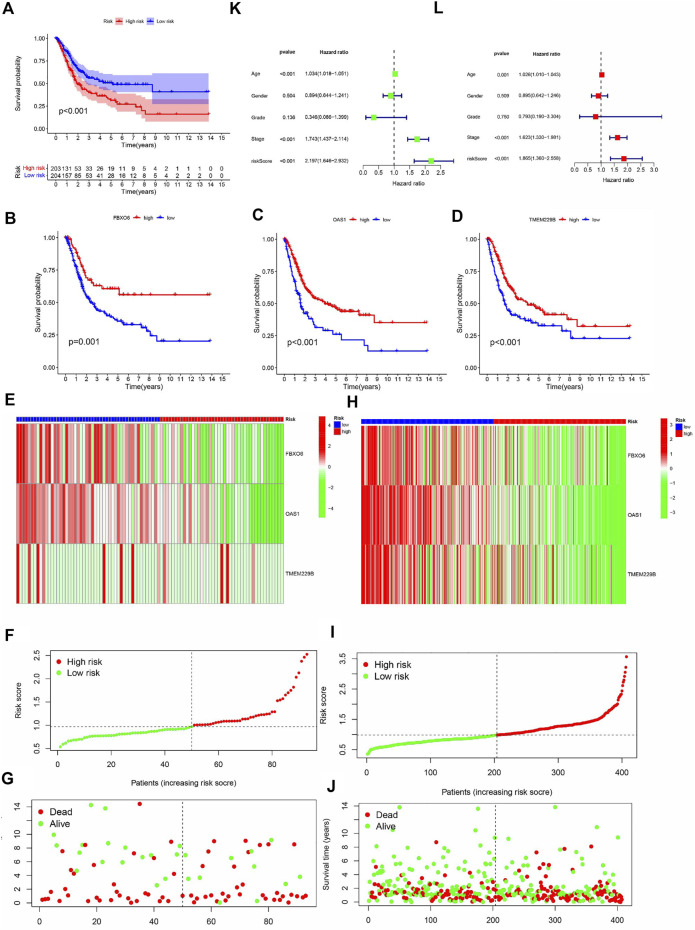
FIGURE 4.
(A) The analysis of Kaplan-Meier curve shows that there is a difference in the overall survival rate between high-risk and low-risk groups. Kaplan-Meier curve analysis showed that there were differences in the overall survival rates of FBXO6 (B), OAS1 (C), and tem229b (D) in high/low-risk groups. In the GEO (E) and TCGA (H) cohorts, heat maps of FBXO6, OAS1, and TME229 gene ratios were drawn for each BLCA sample. In the GEO cohort(F) as well as in the TCGA cohort (I), the distribution of multi-genes model risk score. In the GEO cohort(G) as well as in the TCGA cohort(J), the survival status and duration of BLAC patients.

