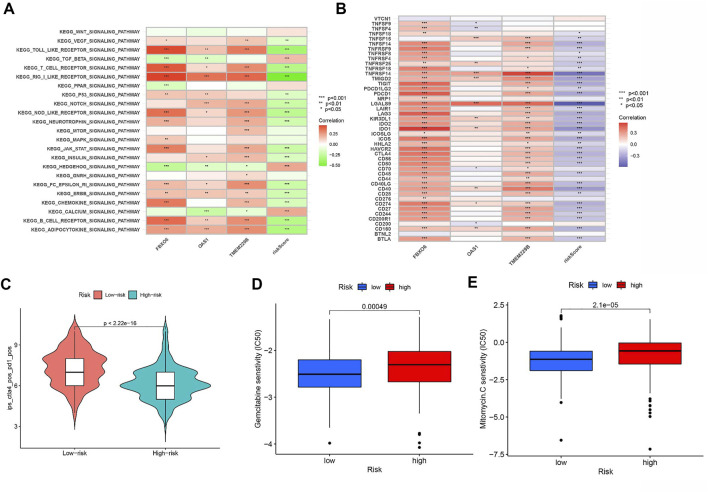
FIGURE 9.
(A) Heatmap showing the correlation of representative pathway terms of KEGG with risk score. (B) Correlation of expression level of immune checkpoint blockade genes with risk score. (C) IPS score distribution plot. Estimation of risk score of chemotherapeutic effect. (D) Sensitivity analysis of Gemcitabine in patients with high and low risk score. (E) Sensitivity analysis of Mitomycin C in patients with high and low risk score.

