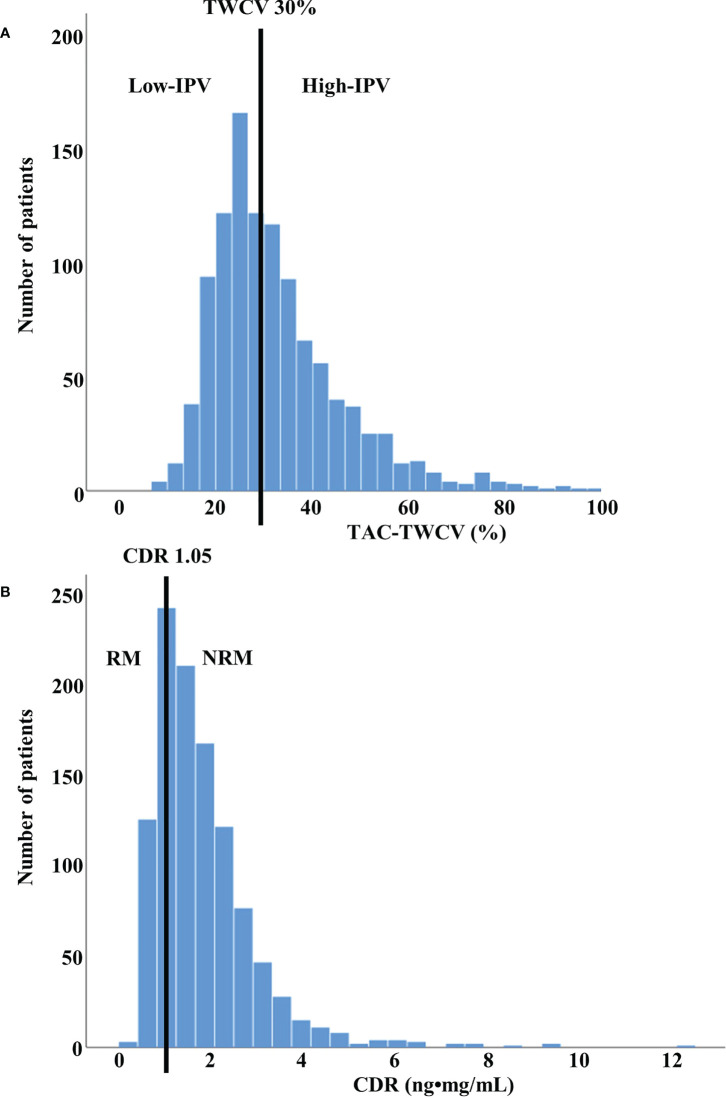
Figure 2.
Distribution of TWCV and CDR values in study population (A) The distribution of TWCV in the study population for the first year after transplant using TAC-C0. The patients were classified into low- and high-IPV groups based on TWCV values of ≥30% or <30%, respectively. The low-IPV and high-IPV groups included 558 and 522 patients, respectively. (B) The distribution of CDR in the study population for the first 3 months after transplant using TAC-C0. Patients with CDR > 1.05 ng•mg/mL and CDR < 1.05 ng•mg/mL were classified as NRM and RM, respectively. NRM and RM groups included 827 and 253 patients, respectively. CDR, concentration-to-dose ratio; IPV, intra-patient variability; NRM, non-rapid metabolizer; RM, rapid metabolizer; TAC-C0, tacrolimus trough level; TWCV, time-weighted coefficient variation.

