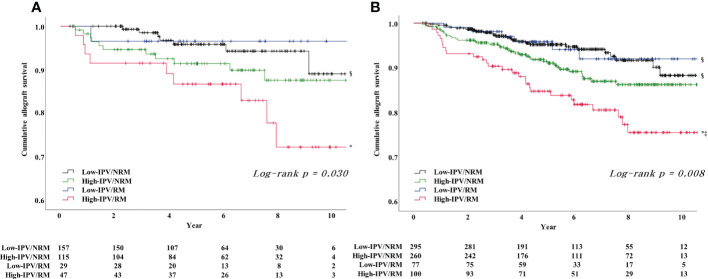
Figure 4.
Result of Kaplan–Meier survival analysis for allograft survival for each PRA-positive and -negative subgroups based on TAC-IPV and RM/NRM status. (A) Allograft survival in the PRA-positive subgroup was the lowest in the high-IPV/RM group, and the allograft survival rate was remarkably reduced compared to the rates of the overall cohort and PRA-negative subgroup. (B) Allograft survival in the PRA negative subgroup was the lowest in the high-IPV/RM group, and the allograft survival rate was comparable with those of the overall cohort. *Log-rank P <0.05 versus low-IPV/NRM group; ‡log-rank P <0.05 versus low-IPV/RM group; §log-rank P <0.05 versus high-IPV/RM group.

