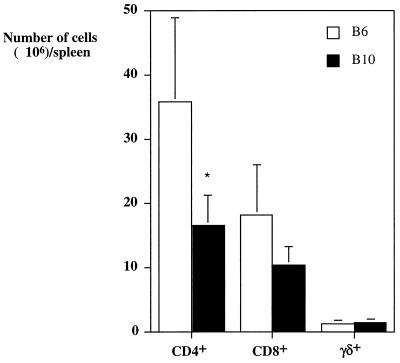
FIG. 2.
Numbers of CD4+, CD8+, and γδ-TCR+ T cells in the spleens of C57BL/6 (open columns) or C57BL/10 (solid columns) mice infected for 4 weeks with M. avium. Statistically significant differences between the two strains are labeled (∗, P < 0.05; as determined by the Student's t test). Cells from individual mice were analyzed, and four mice per group were used.

