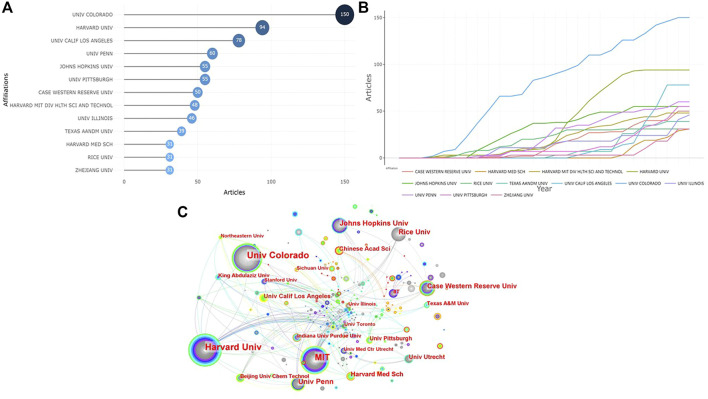
FIGURE 4.
Visualized analysis of institutions concerning the publications of photosensitive hydrogels for TE applications. (A) The top 10 institutions with the most published articles; (B) Production of the top 10 institutions with the highest productivity over time. (C) The network map of collaboration relations between institutions.

