
Figure 7.
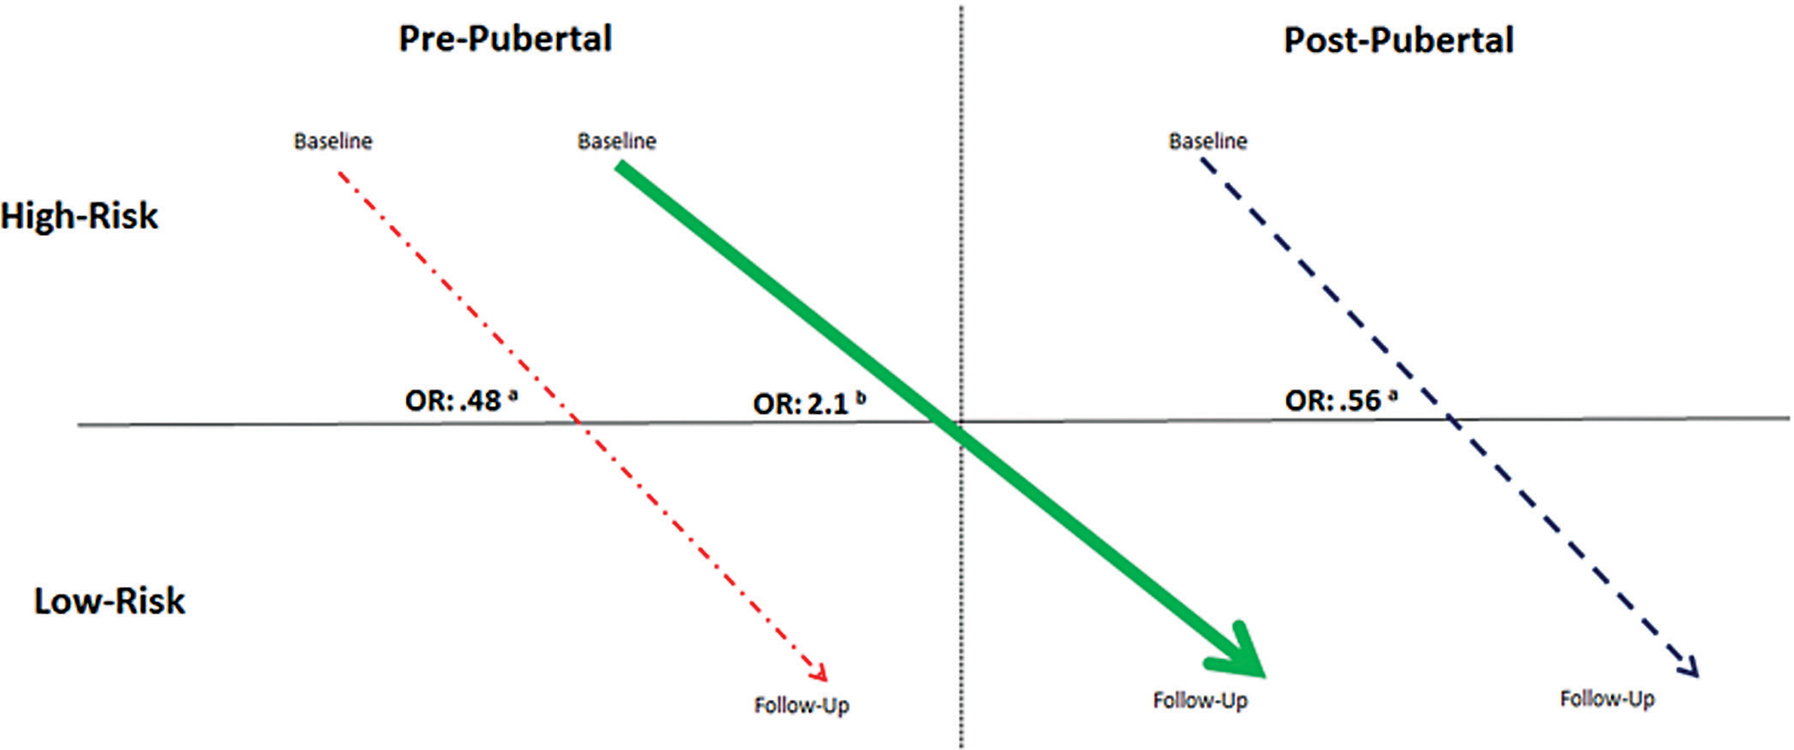
Pubertal maturation in hip profile. When compared with athletes in the change group (thick line), athletes whose maturational status remained unchanged over the course of the study (dotted and dashed line = prepubertal from baseline to follow-up; dashed line = postpubertal from baseline to follow-up) had lower odds of moving to the low-risk profile. aOdds ratio comparing athletes who matured over the course of the study to those who did not mature over the course of the study. bOdds ratio comparing athletes with a high-risk profile who matured over the course of the study to athletes with a high-risk profile who did not reach postpubertal status.