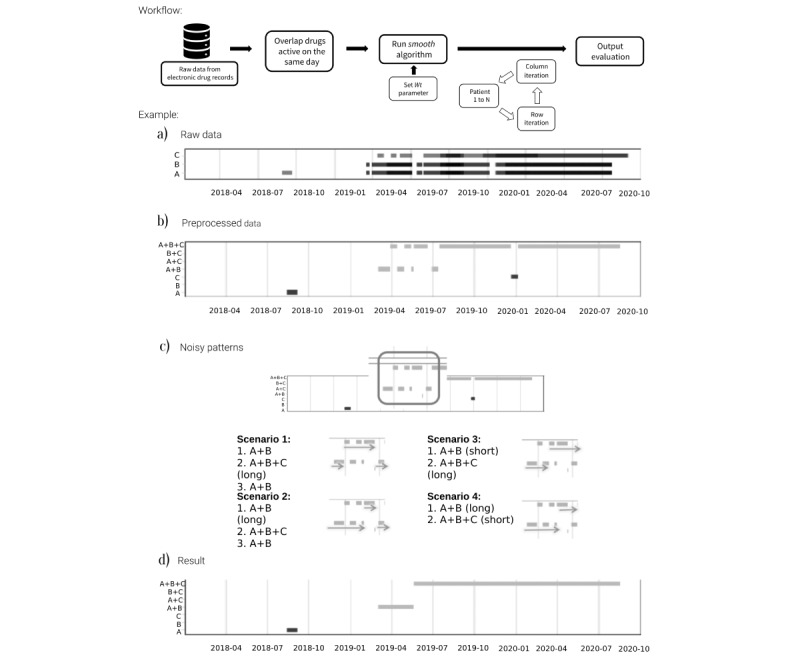
Figure 1.

Overview of the smooth algorithm workflow with an illustrated example. (A) Horizontal axis is follow-up time in days, and the vertical axis is the different drugs prescribed. Box length indicates the period in which the prescription is active. (B) Patient profile after combining all active prescriptions in the same day, the first step of data process. (C) Example of complex patterns and 4 ways to overcome them. (D) Result obtained after passing the data through the smooth algorithm.
