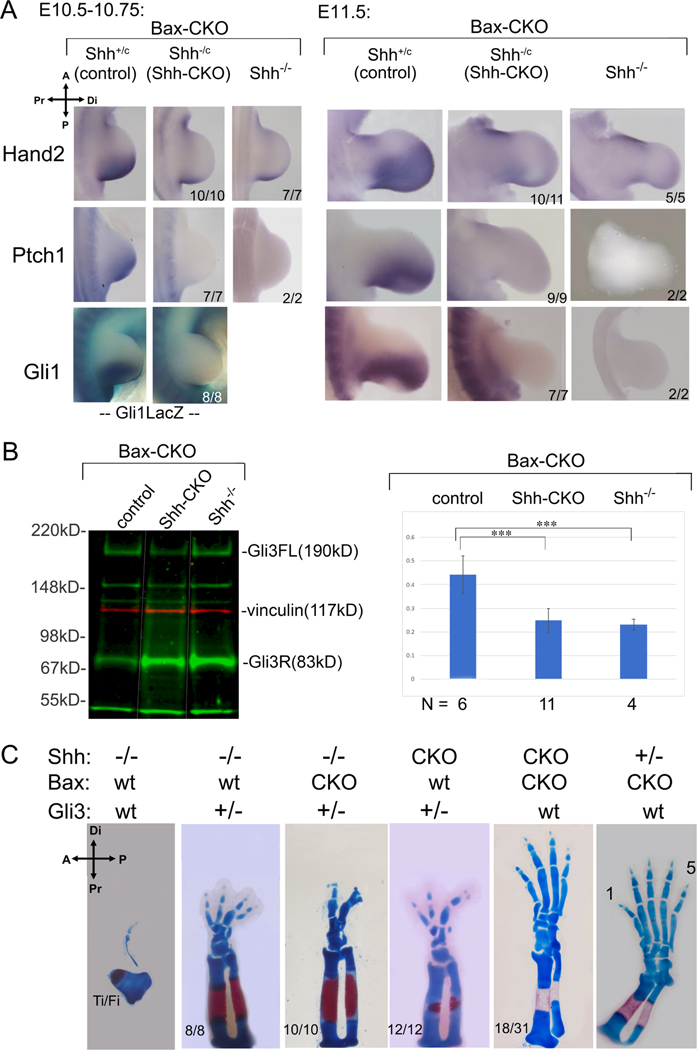
Figure 4. Digit rescue in Shh-CKO;Bax-CKO embryos is not due to persistent Shh pathway activity or re-activation.
(A) Shh pathway activity monitored by RNA (Hand2, Ptch1, Gli1) and by LacZ activity from a Gli1LacZ/+ knock-in allele after Shh removal by tamoxifen at E9.5+3h (as in Figure 1B). Mutant numbers analyzed with result shown are indicated in each panel. Hand2 at E11.5 was very slightly higher than Shh−/− in 1/11 Shh-CKO embryos. (B) Gli3 full-length (Gli3FL) and repressor (Gli3R) protein quantitation in E10.5 hindlimbs, after Bax/Bak and Shh removal as in Figure 1B,C. Blot shows representative example of Gli3 level (green) for different genotypes (noncontiguous lanes re-ordered from same blot, indicated by white lines). Molecular weight marker positions indicated to right; vinculin (red) loading control. Gli3 FL/R ratios (mean + SEM) shown at right in bar-graph with numbers analyzed (N) for each genotype. Gli3 FL/R is equivalently reduced in Shh-CKO;Bax-CKO (p=0.00002) and in Shh−/−;Bax-CKO (p=0.001) compared to control, and there is no significant difference in Gli3 FL/R between Shh-CKO;BaxCKO and Shh−/−;Bax-CKO (p=0.48). ***, p <0.001. (C) Effect of Gli3 dosage reduction (Gli3+/−) on Shh-CKO and on Shh−/− skeletal phenotypes (E16.5), compared to the effect of Bax/Bak removal (Bax-CKO).

