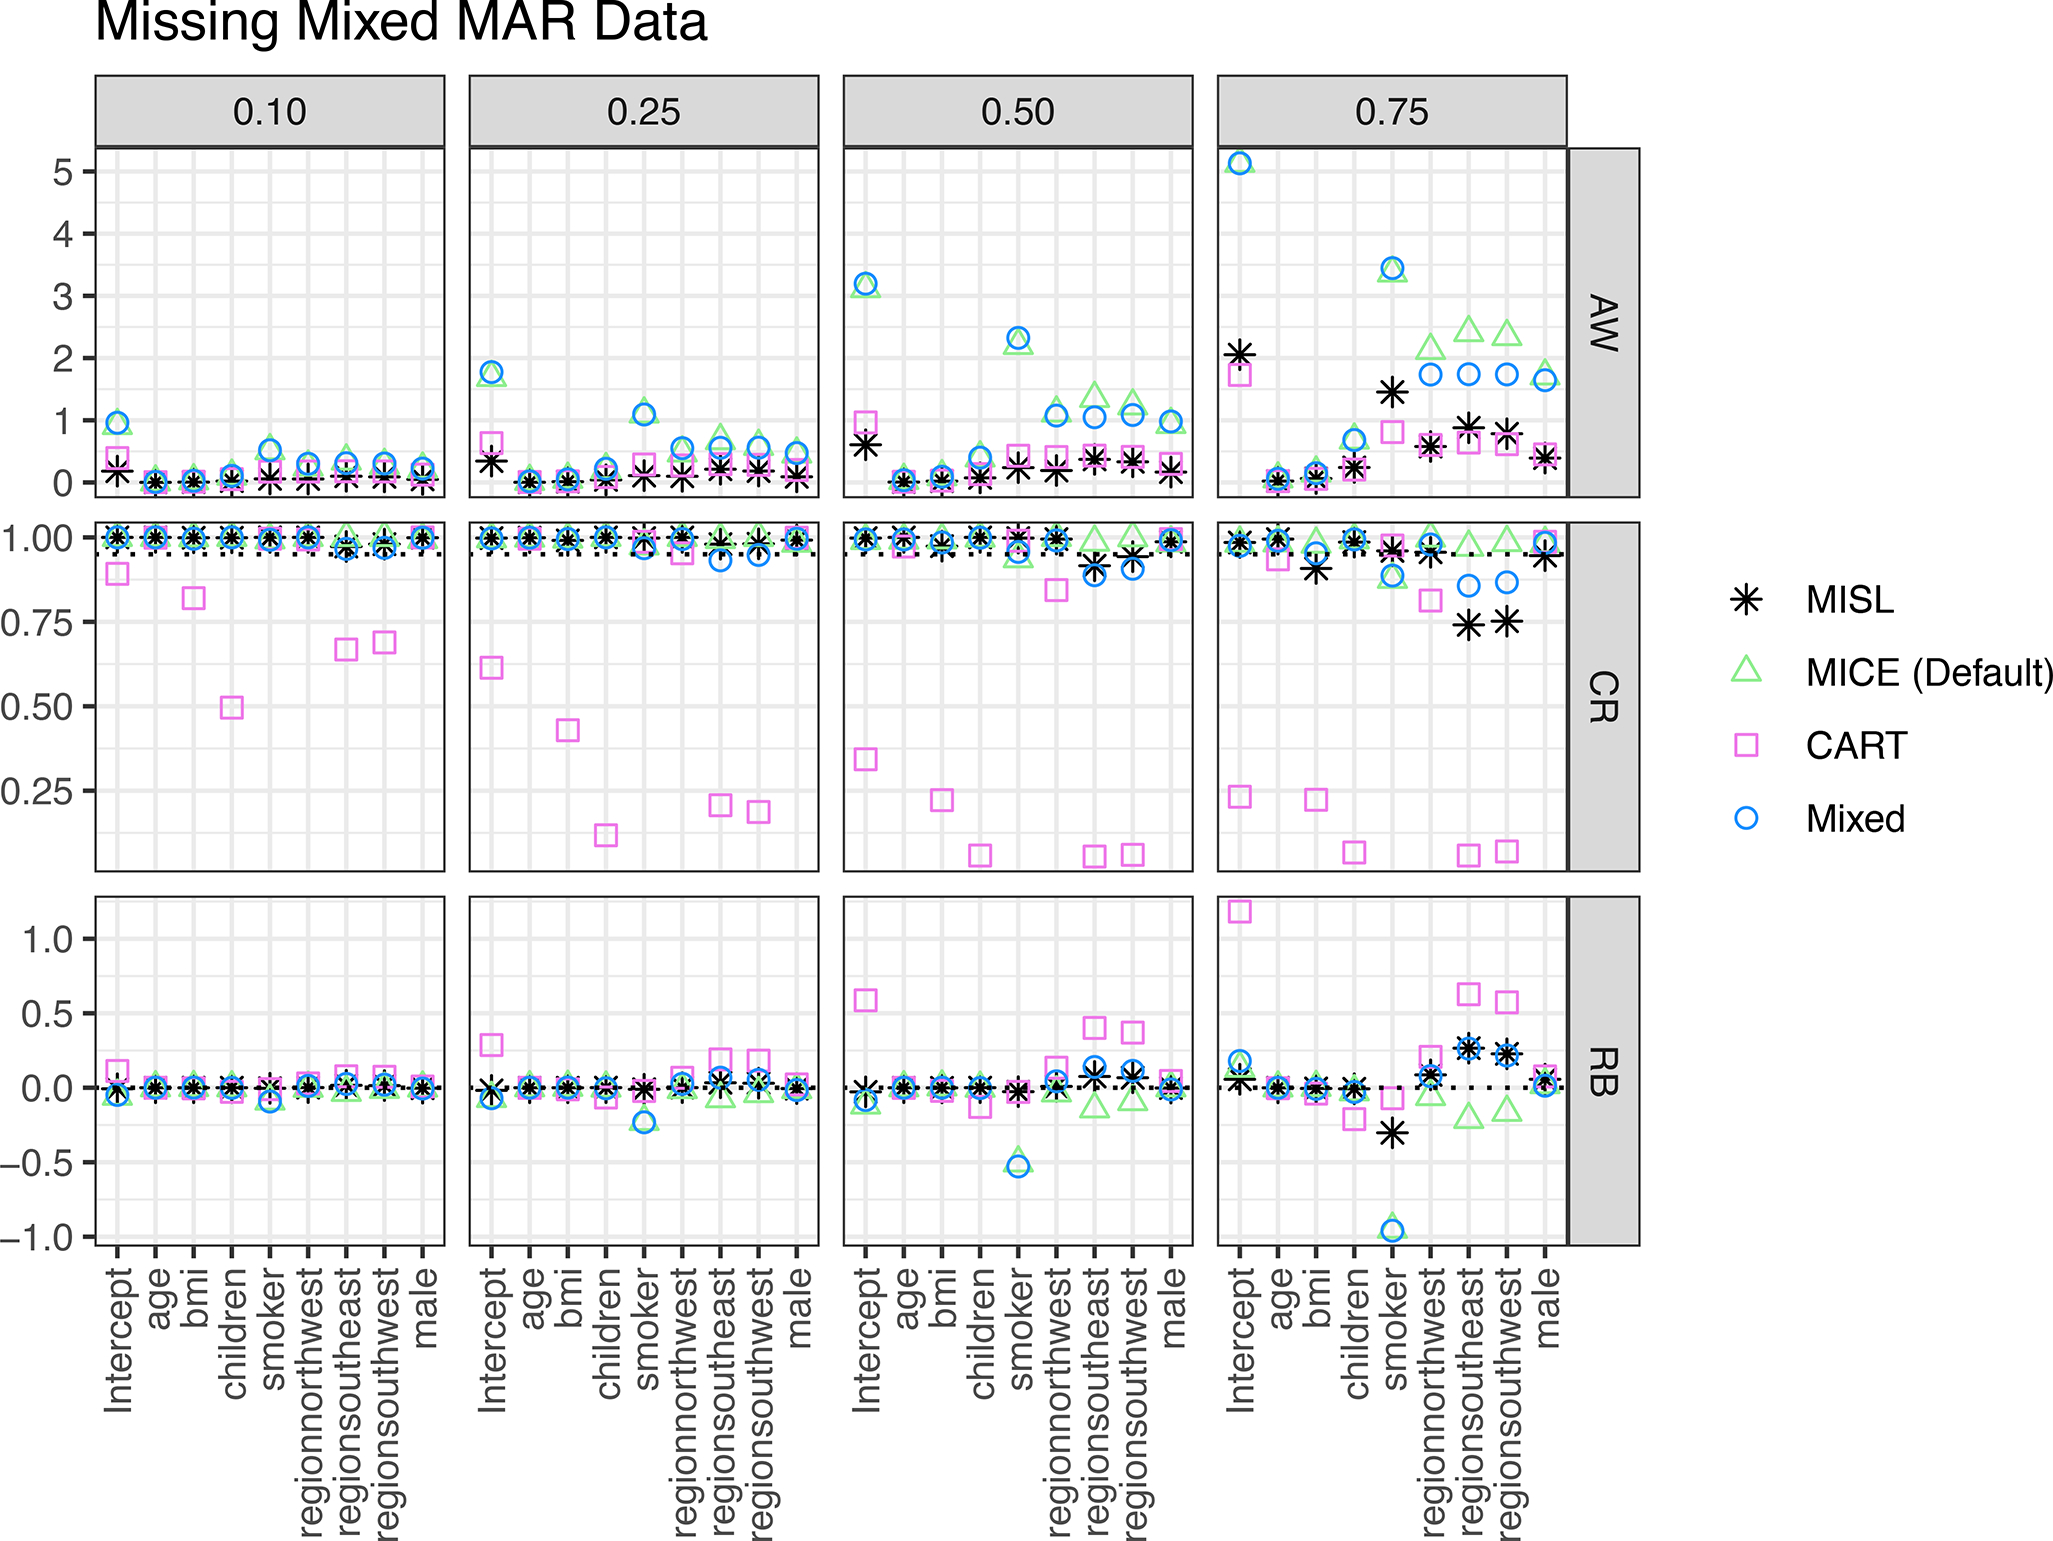
Figure 5:

Simulation results including average 95% confidence interval width (AW), coverage rate (CR), and raw bias (RB) for regression coefficients based on 1,000 simulations of MAR missingness present in both the covariates and outcome across different proportions of missing data (0.10, 0.25, 0.50, 0.75). Methods include MISL, the default methods in MICE (MICE (Default)), classification and regression trees (CART), and a combination of the default imputation methods in MICE along with classification and regression trees (Mixed).
