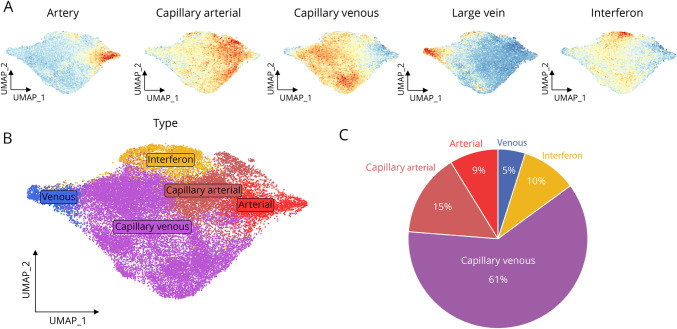
Figure 3. Characterization of EC Phenotypes.
(A) Mapping of module score generated from distinct murine brain EC signatures onto the integrated uniform manifold approximation and projection (UMAP). (B) Integrated UMAP projection of ECs colored by subtypes. (C) Pie chart of the proportions of each identified EC subpopulation. Abbreviation: EC = endothelial cell.

