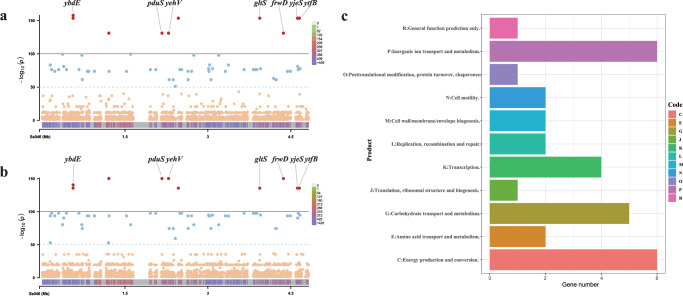
Fig. 5. The SNPs identified by a GWAS are associated with cefRaziR isolates and the outbreak strains.
a and b separately show SNPs identified by a GWAS associated with outbreak strains and cefRaziR strains. The red dots represent significantly associated (P < 1e-100) SNPs, while the blue dots represent SNPs with a P value <1e-50. The thresholds P = 1e-100 and P = 1e-50 are indicated by a red line and a blue line, respectively. The bottom band shows the density of SNP distribution. c shows COG function classifications of SNPs with P < 1e-50. These SNPs are mainly associated with transport, energy production, and transcription. Source data are provided as a Source Data file. SNP single-nucleotide polymorphism, GWAS genome-wide association study, cefRaziR coresistance to ceftriaxone and azithromycin, COG Cluster of Orthologous Groups.

