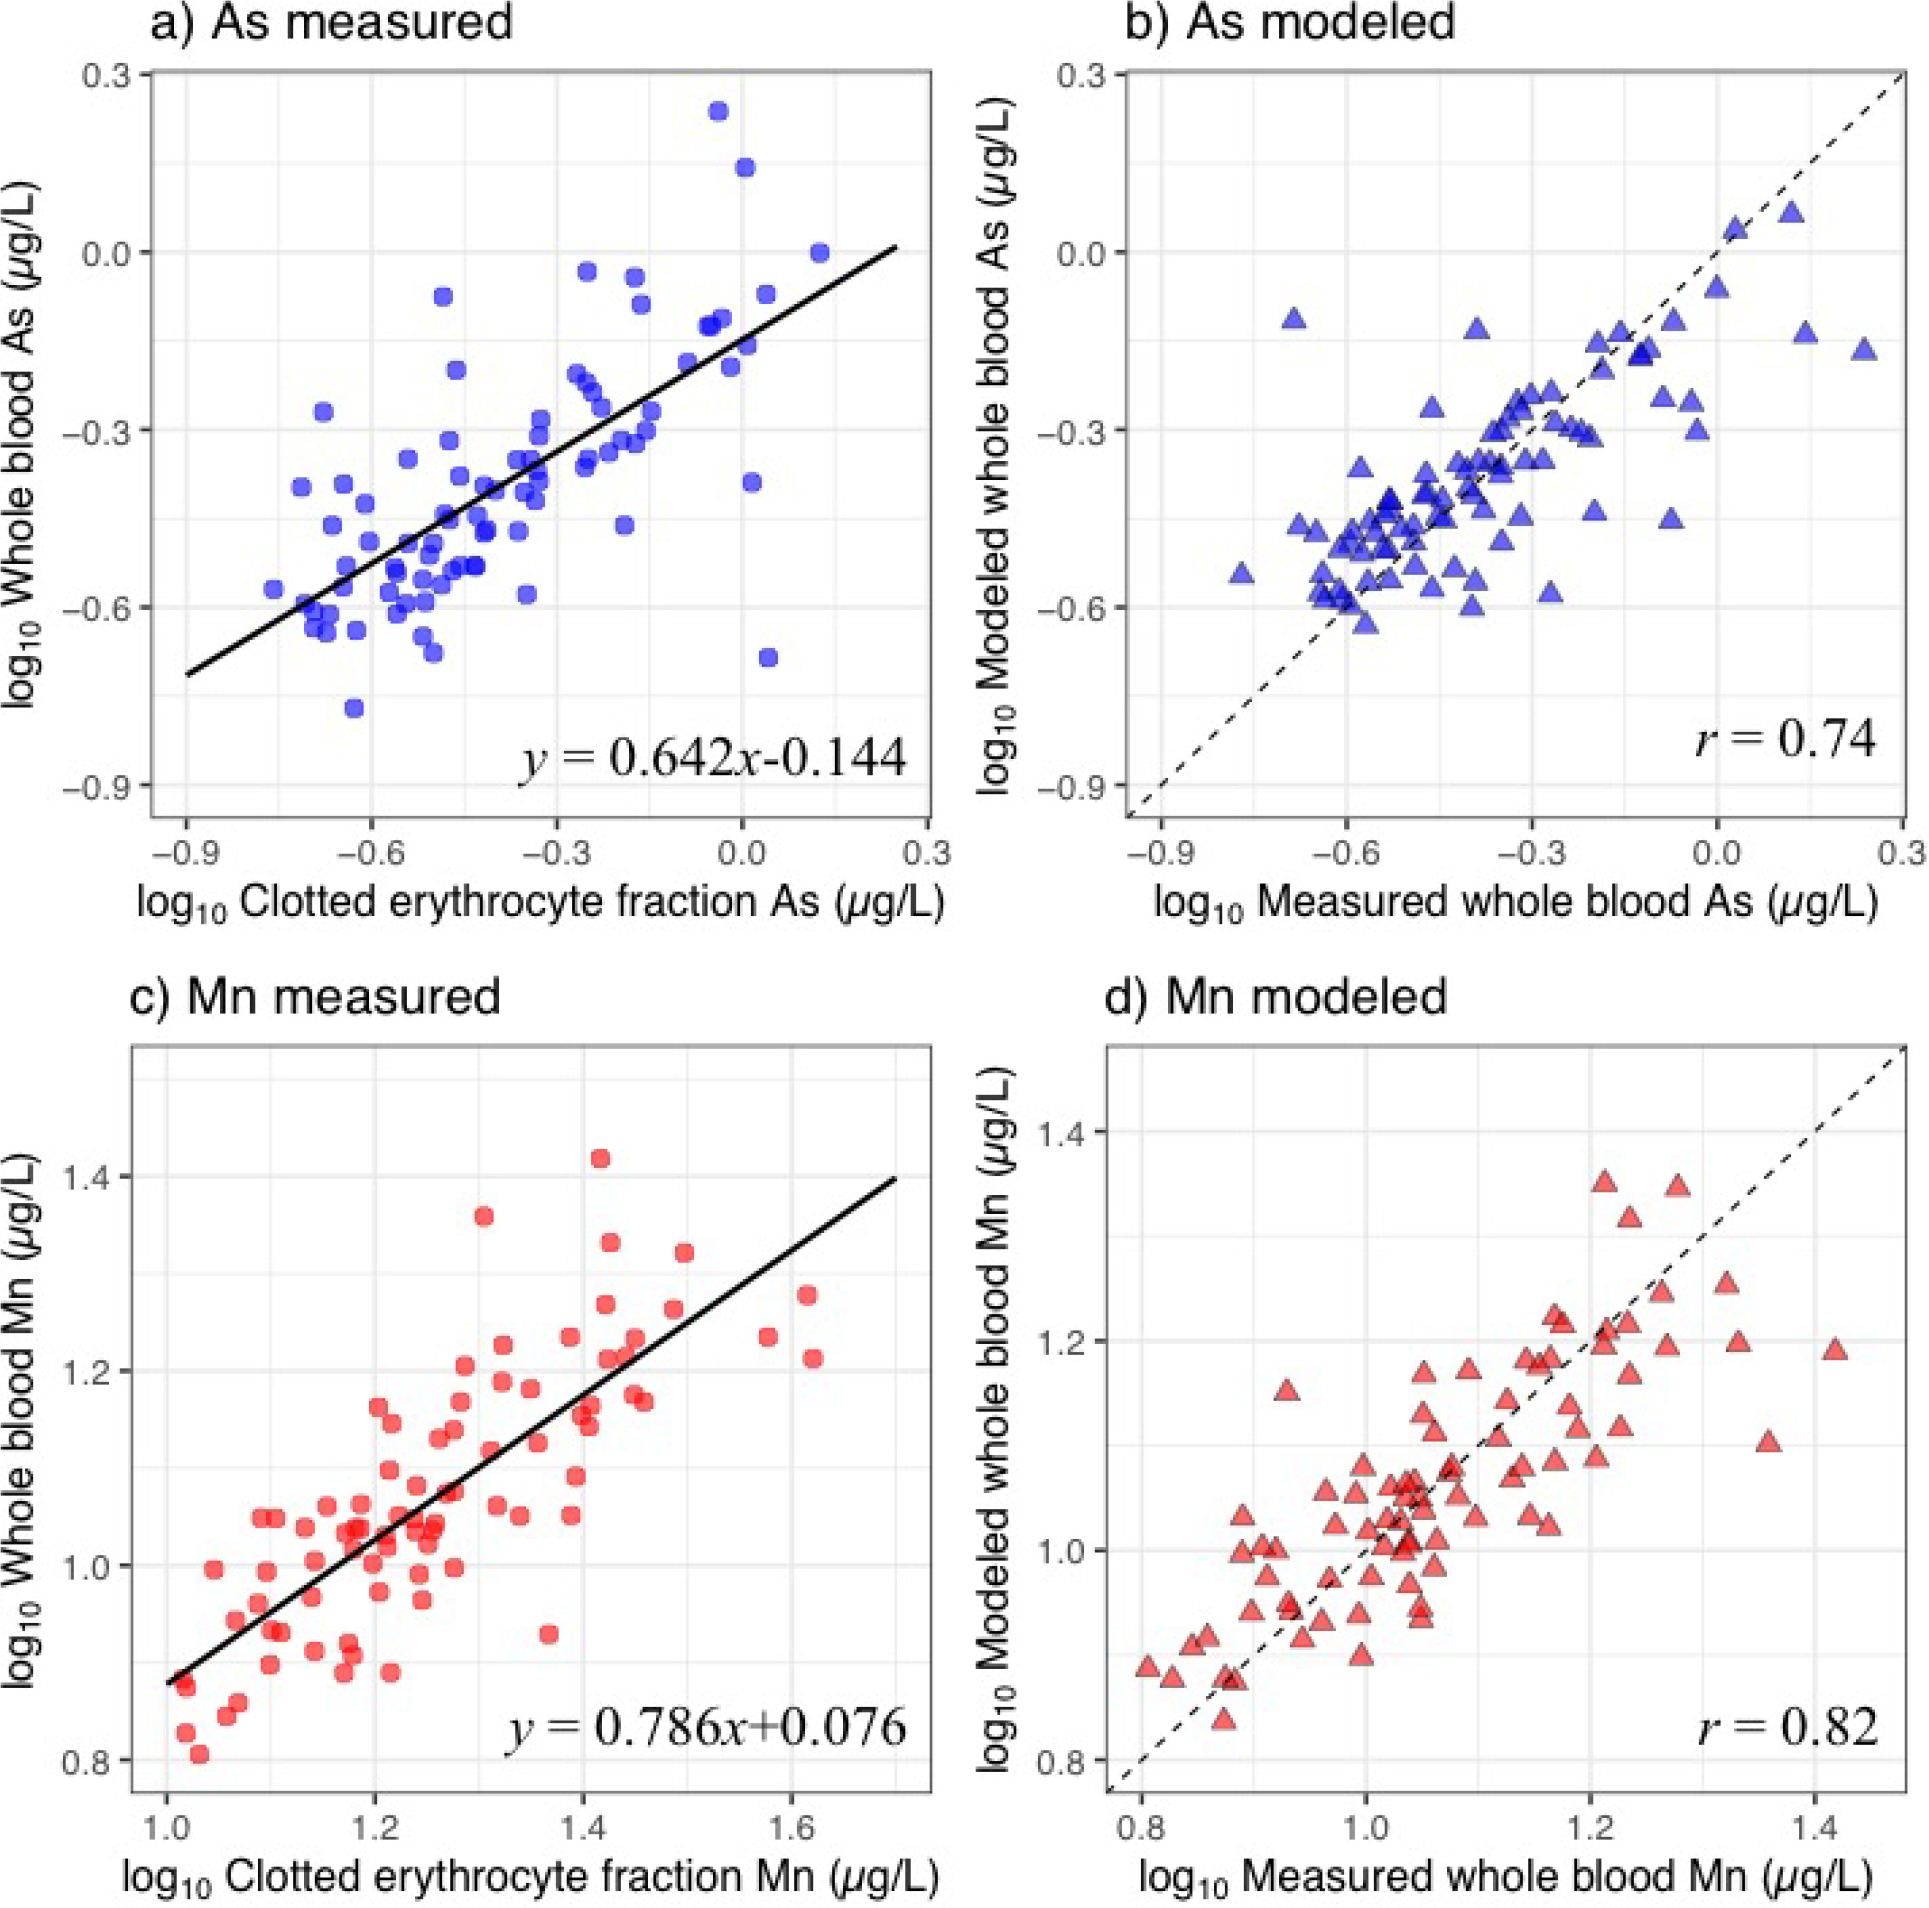
Figure 1.

Plots of concentrations of arsenic (As) (a) and manganese (Mn) (c) measured in clotted erythrocyte fraction against whole blood overlaid with the linear regression line. Plots of concentrations of As (b) and Mn (d) measured in whole blood against modeled whole blood predicted from clotted erythrocyte fraction. Dashed line represents line of identity.
