
Figure 3.
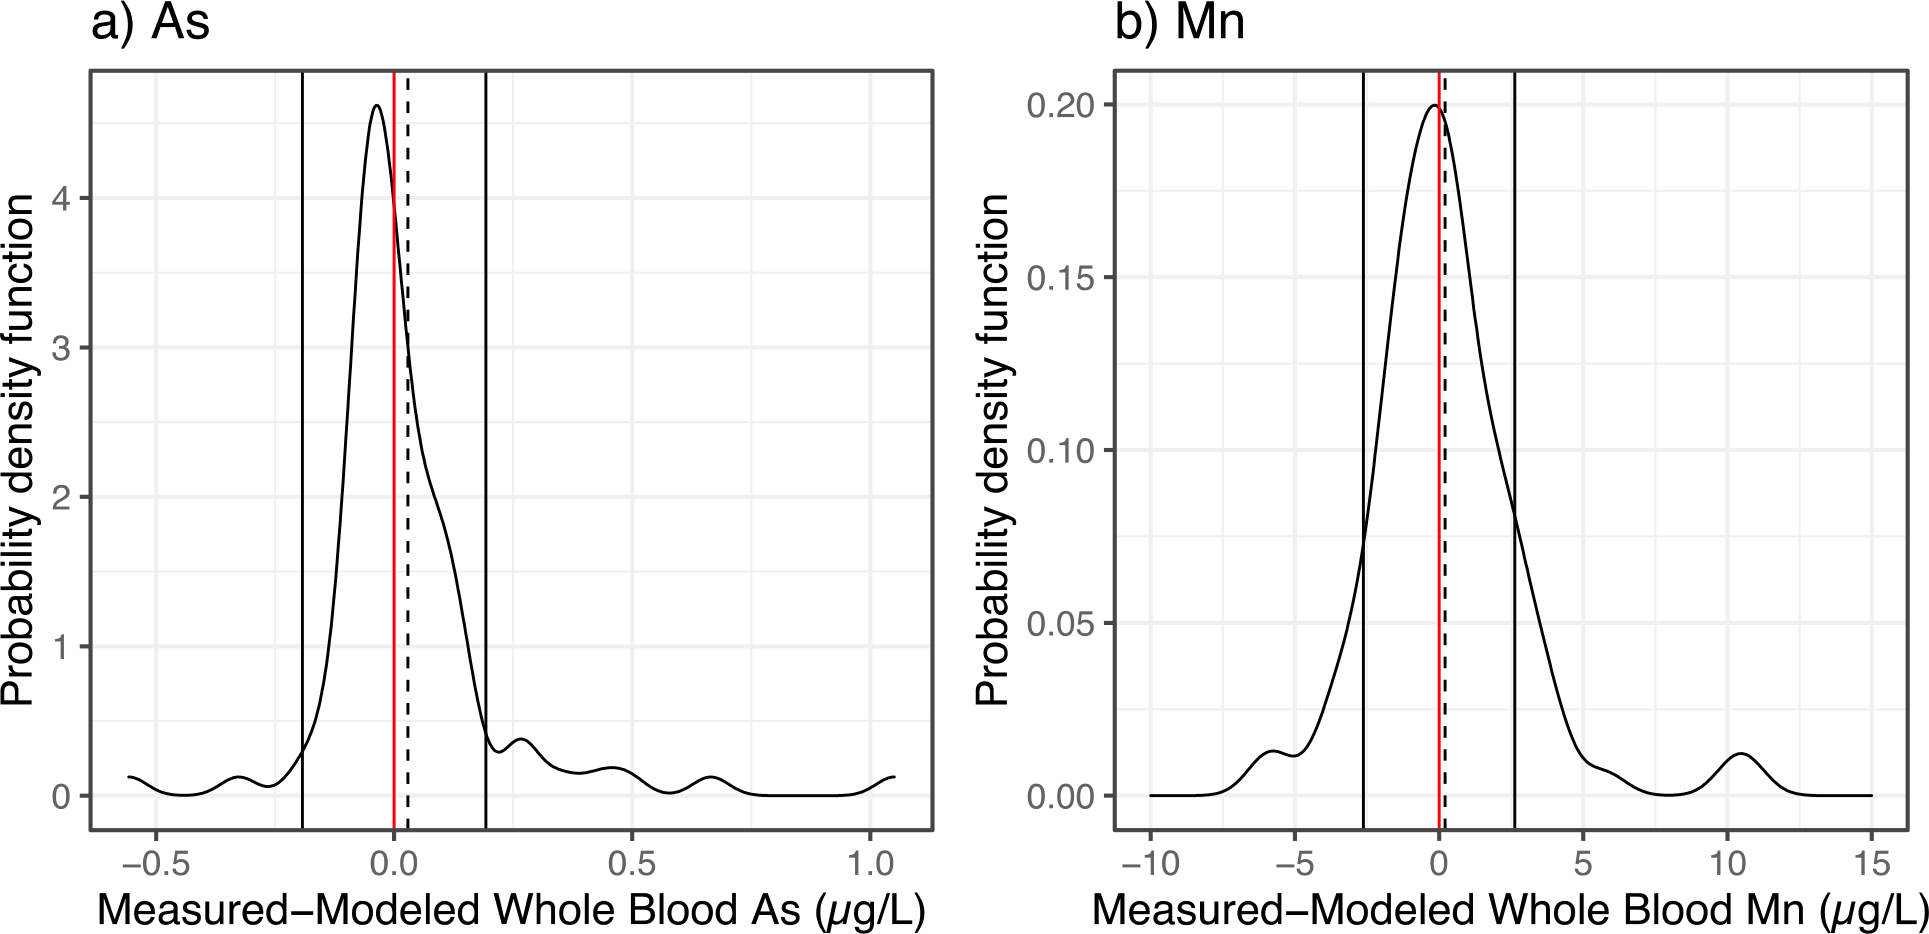
Modified visual representation of the Bland-Altman analysis showing the distribution of the differences between the measured and modeled whole blood levels for As (a), and Mn (b) predicted using clotted erythrocyte fraction samples. The solid vertical lines represent the 95% confidence interval and dashed lines represent the mean method difference. Red line represents a value of 0 for the difference between measured and modeled value.