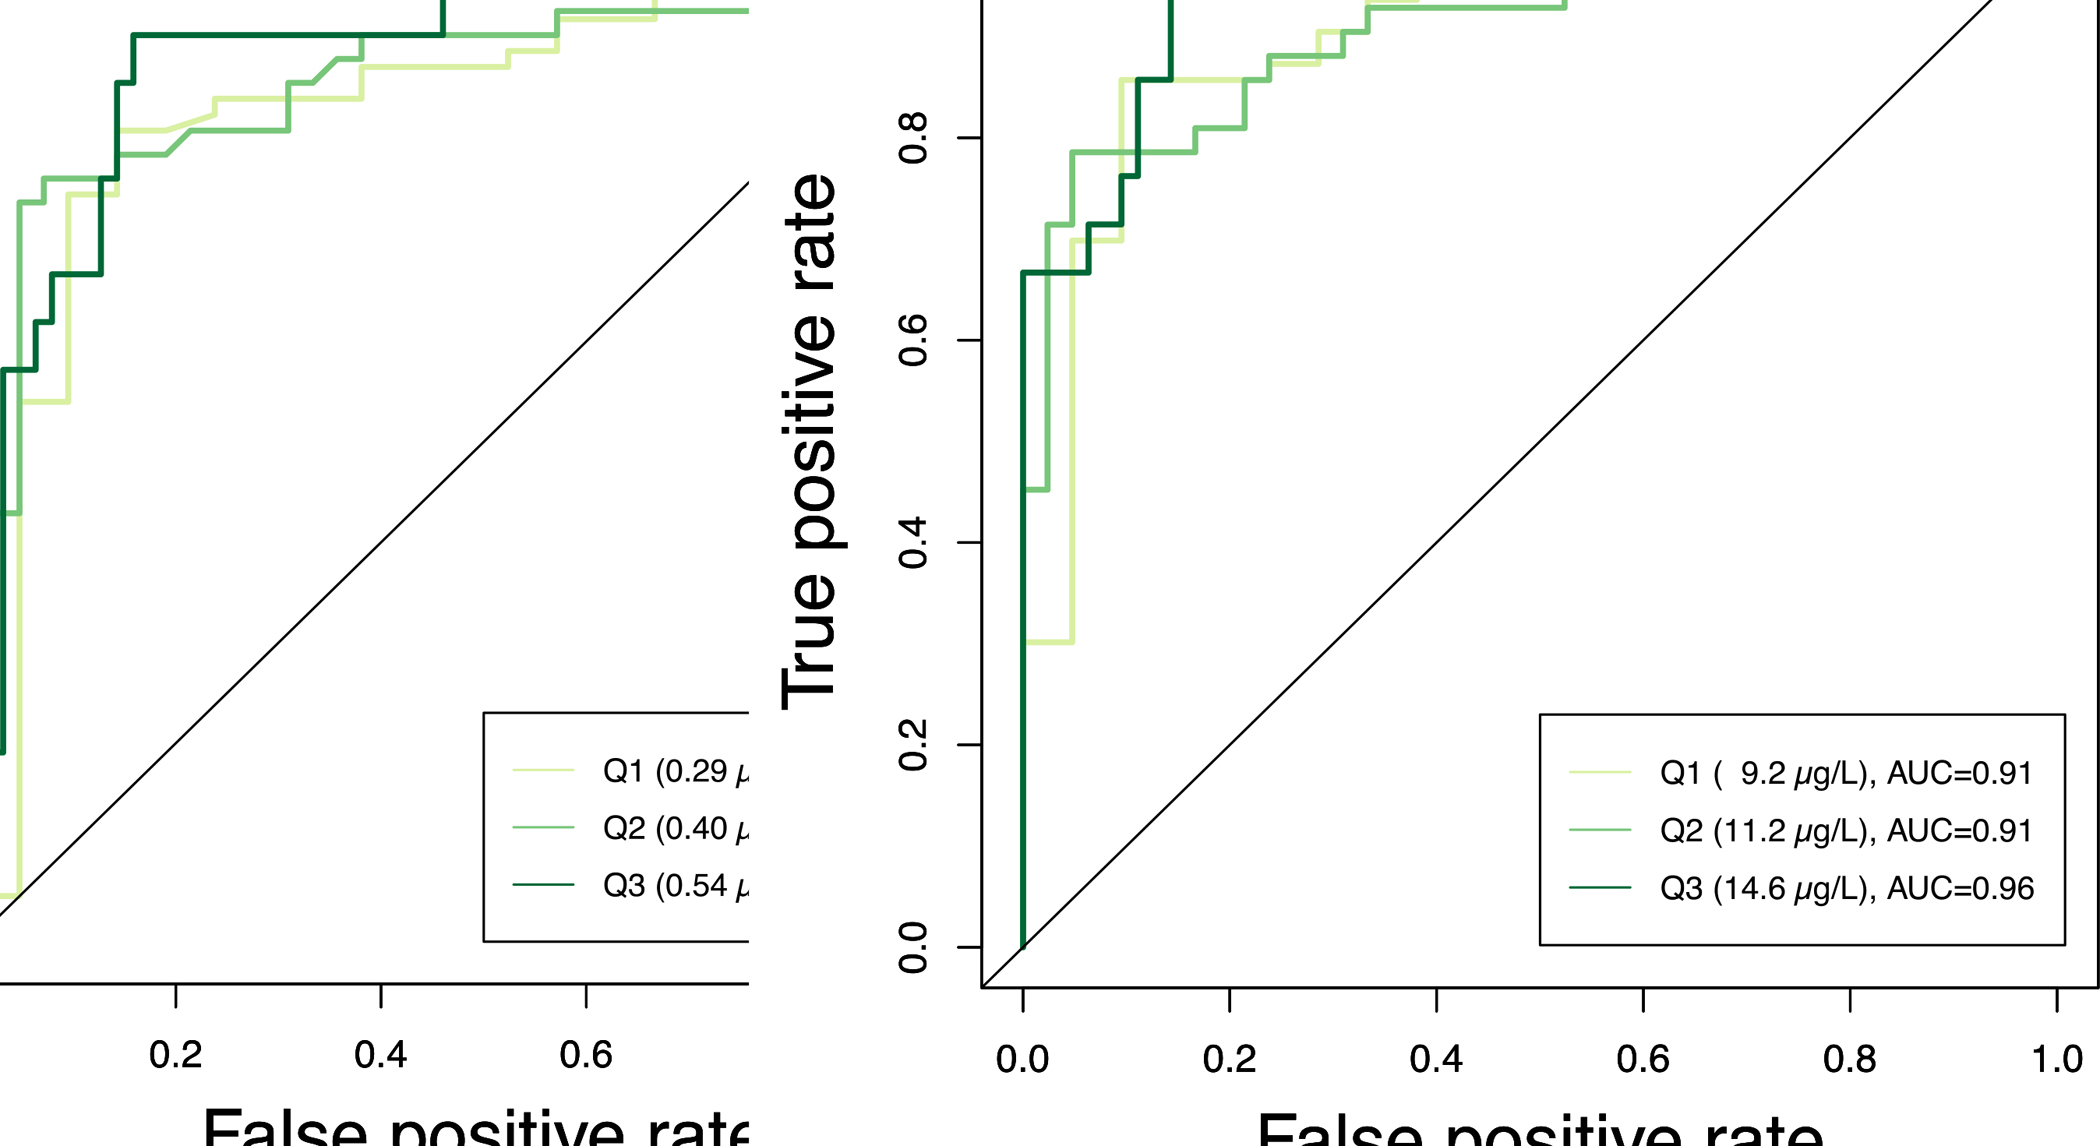
Figure 4.

Receiver operating characteristic (ROC) analysis of true positive rate (sensitivity) and false positive rate (1-specificity) clotted erythrocyte fraction predicted whole blood levels for a) As, and b) Mn. The whole blood measurements were designated as the “gold standard” for binary classifications of cutoff values at quartiles (Q) 1, 2, and 3. Area under the curve (AUC) is provided as a measure of overall model performance. The identity line is plotted as a comparison to represent rates of binary classification occurring by chance.
