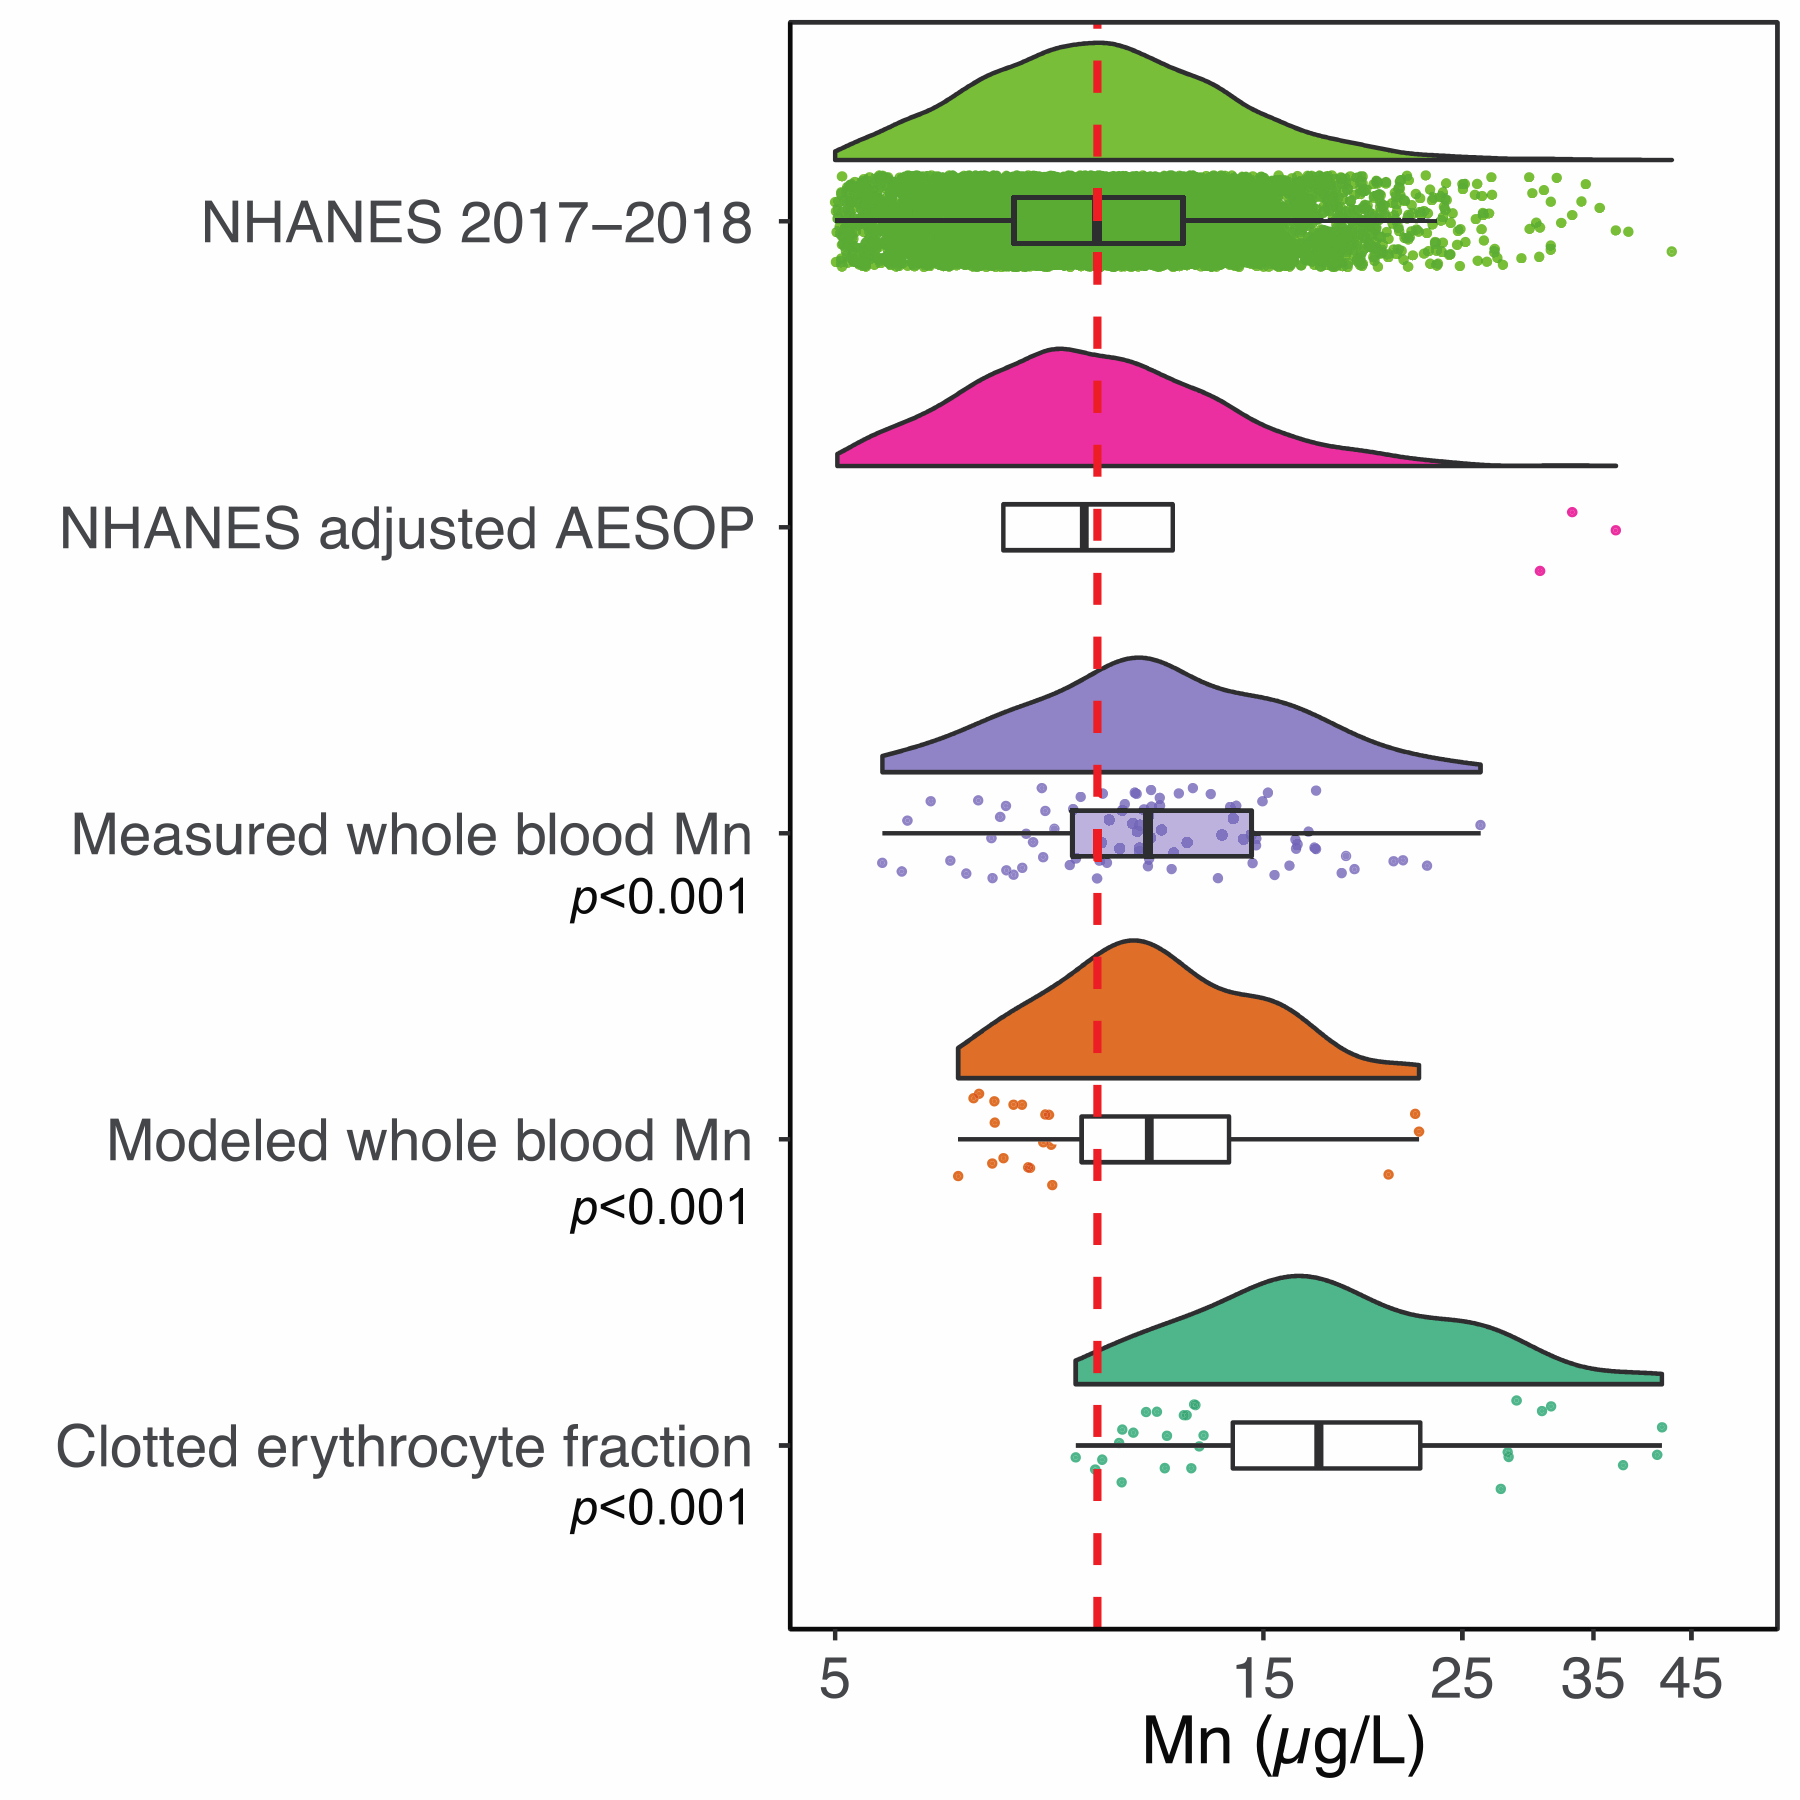
Figure 6.

Raincloud plots displaying the distribution of blood manganese levels from NHANES dataset, as well as the AESOP dataset stratified by clotted erythrocyte fraction, measured and modeled whole blood. One sample t-test p-values comparing against the NHANES media and geometric mean value of 9.7 μg/L (red dashed line) are displayed.
