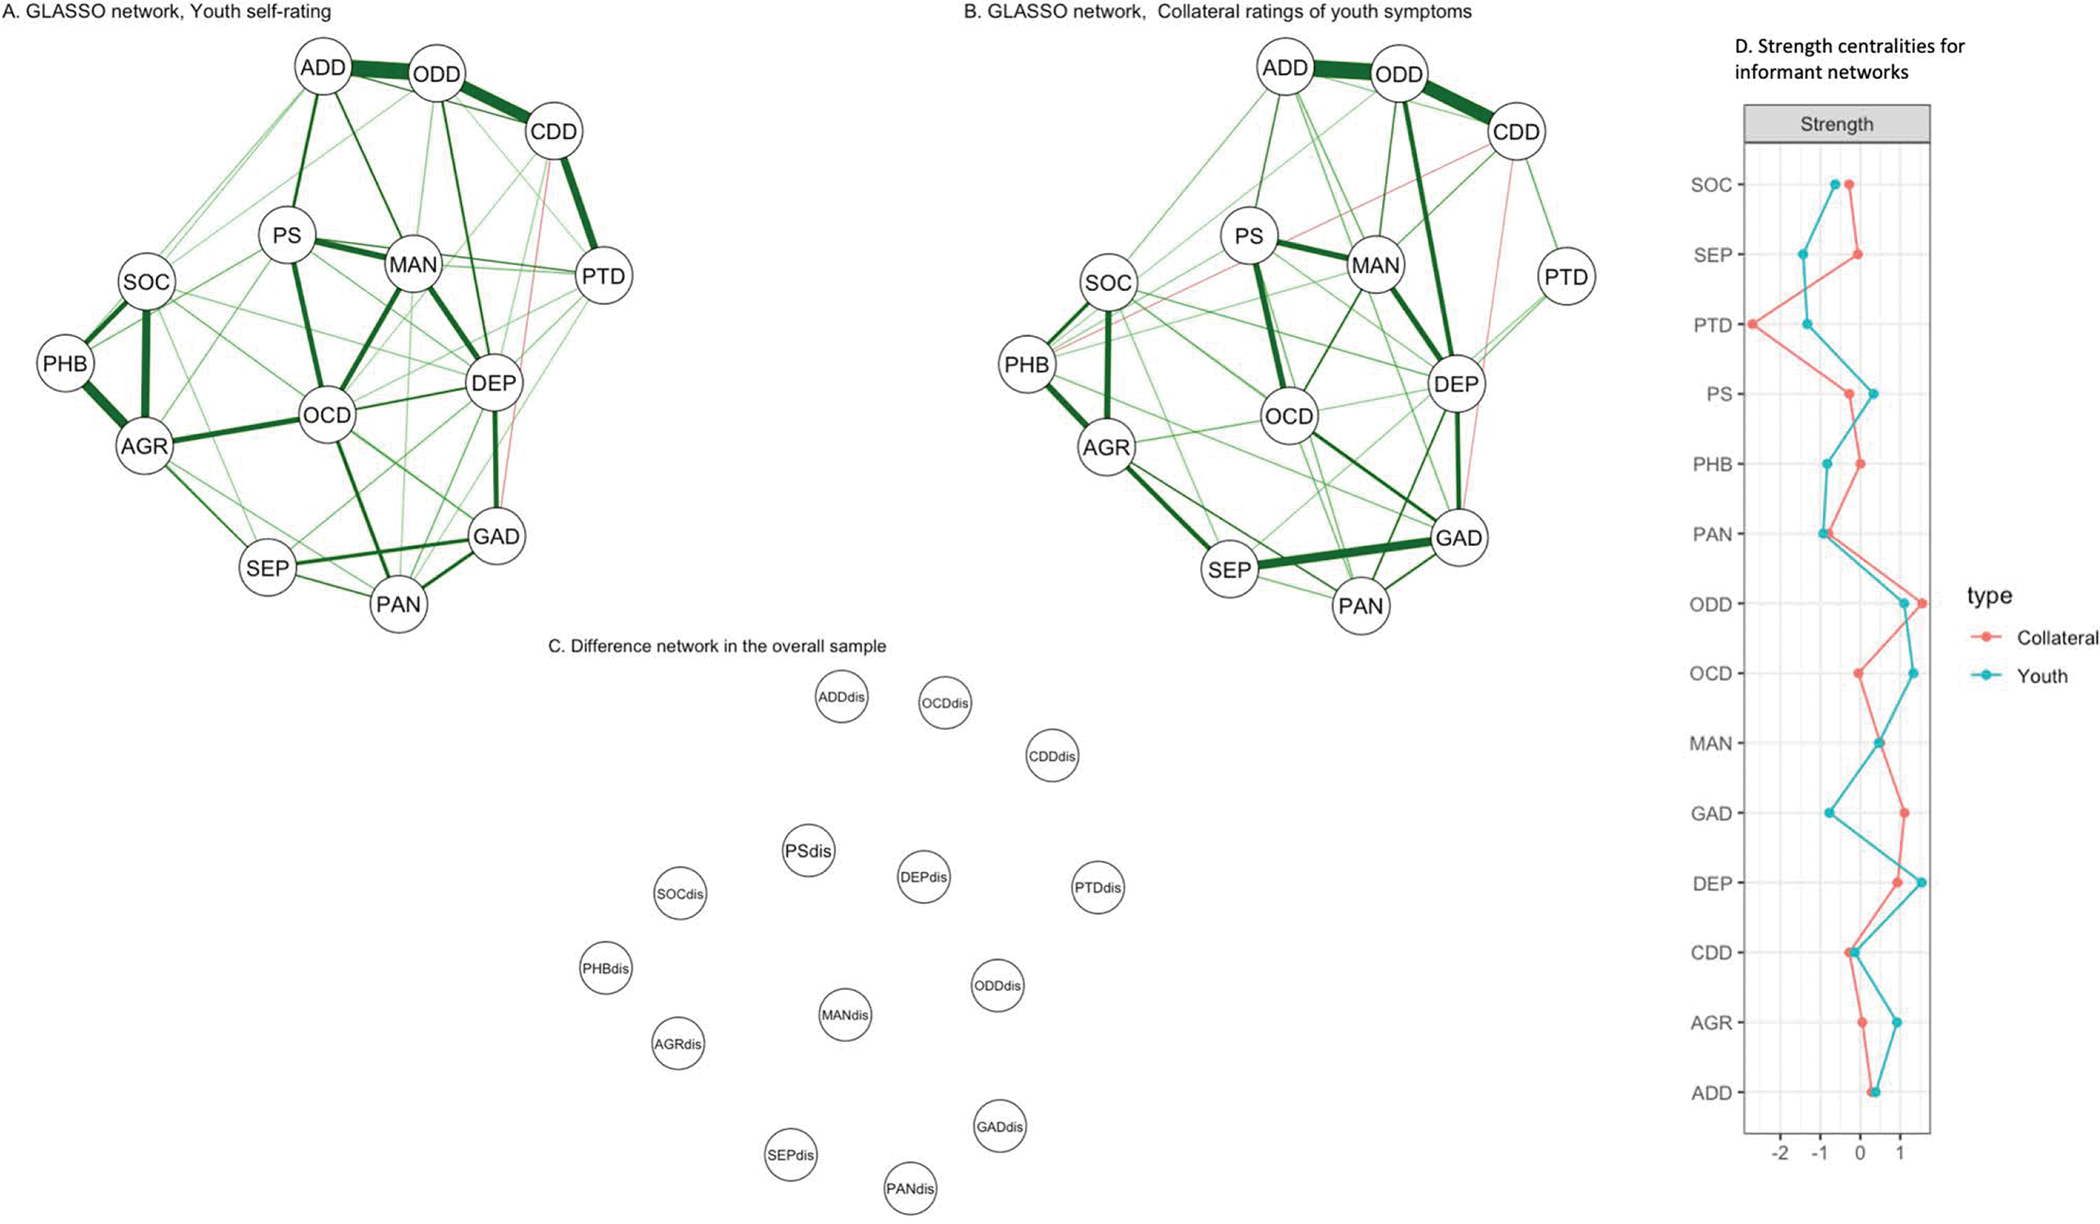
Figure 1:

Networks for youth (1A) and collateral symptom (1B) reports constructed using a graphical lasso or GLASSO method. Nodes are psychopathology symptom domain scores and include ADD-Attention Deficit Hyperactivity ; AGR- Agoraphobia; CDD- Conduct ; DEP= Depression; GAD- Generalized Anxiety ; MAN- Mania; OCD- Obsessive Compulsive; ODD- Oppositional Defiant ; PAN- Panic ; PHB- Specific Phobias; PTD – post-traumatic stress; PSY-Psychosis; SEP-Separation Anxiety; SOC- Social Anxiety.
Green lines on the graph indicate positive associations between nodes, red is negative. Thickness and saturation of the edge weights indicates the strength of the association i.e., the thicker the edge, the stronger the association. In figure 1C, *dis indicates difference scores for the specific domain - e.g., PSdis is difference score for psychosis spectrum. Difference score network (1C) in the overall sample resulted in an empty network indicating no relationship between domain difference scores in the overall sample.
