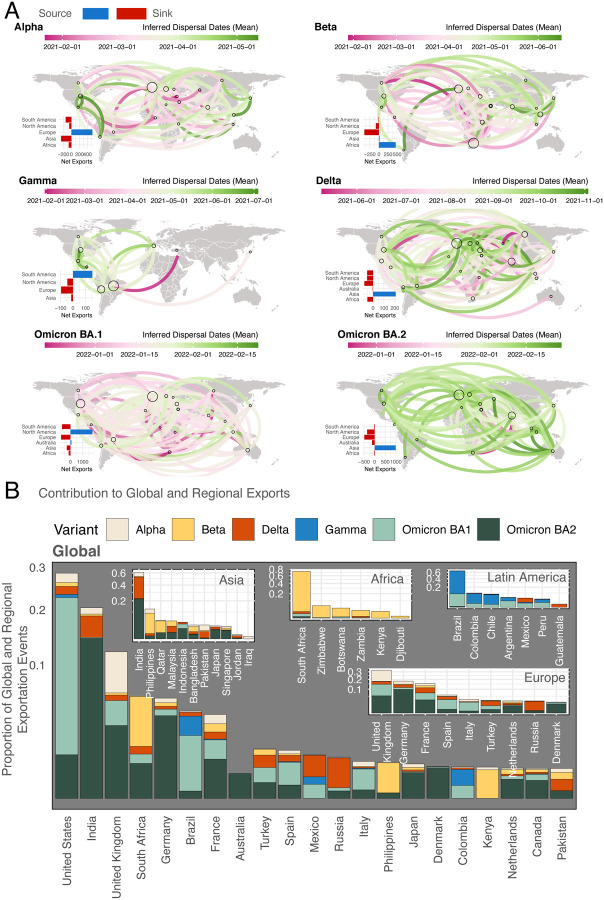
Figure 1: Spatiotemporal dispersal patterns of VOCs.
A) Global dissemination and continental source-sink dynamics for each VOC, determined from ancestral state reconstruction analysis. Virus lineage exchanges are aggregated at sub-continental level and curves linking any two locations are coloured according to the mean dates of all viral movements inferred along this route. The curves denote the direction of movement in an anti-clockwise direction. Circles are drawn proportional to the number of exports per location. Source and sink continents are determined by calculating the net difference between viral exportation and importation events. The absolute numbers of exportation and importation events for each continent per VOC are shown in Figure S5. B) Largest global and regional contributors to viral exports, stratified by VOC. Countries are shown here if they contribute >0.1% of exports globally or within Europe, or >0.5% within other regions.

