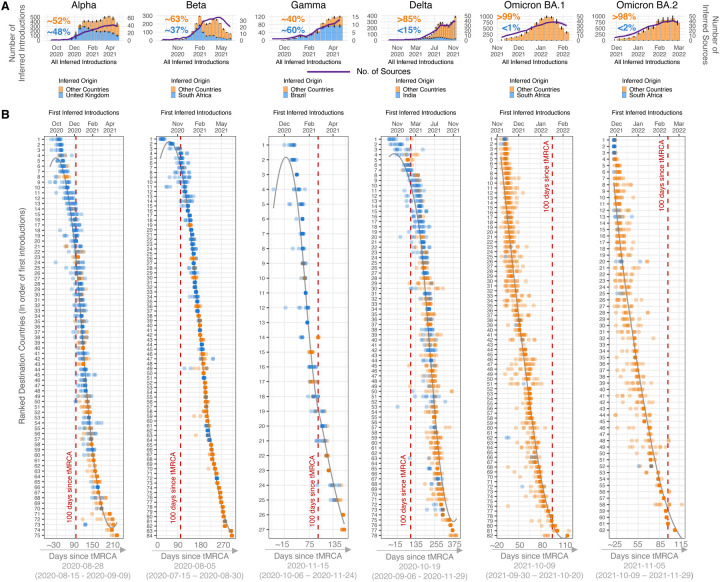
Figure 2: Inferred origins of global VOC dissemination events.
A) Changes in proportions of all inferred introductions from the country of presumed origin for each VOC (bars), and the number of countries inferred to be acting as onward sources of each VOC (purple line, with scale in the second y-axis). Results shown are determined from 10 replicates of genome subsampling. B) Date of first inferred introduction per country coloured by location of origin, i.e. presumed origin (blue) or not (orange). The lines represent countries, which are ranked and labeled by the median of their dates of first introduction (from 10 replicates). The lower x-axis denotes the estimated median tMRCA and confidence interval range dates for each VOC, as reported in published studies1–3,6,8,26.

